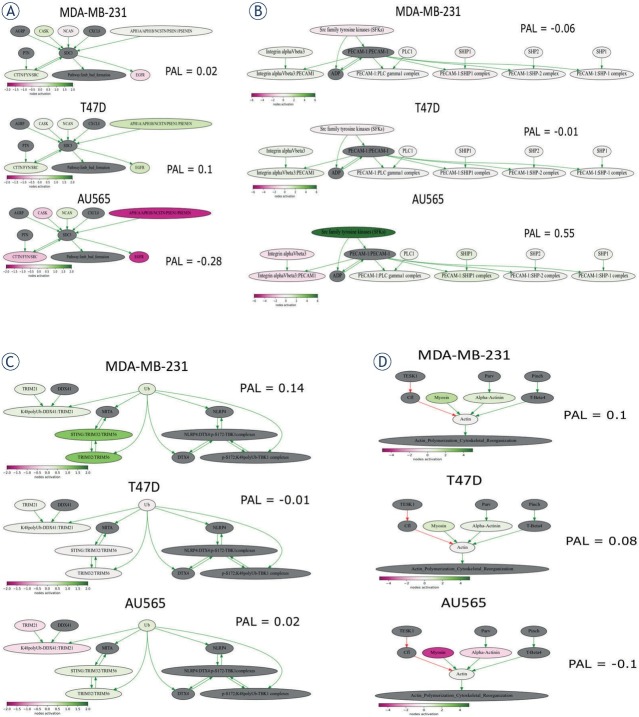
Figure 7.
Visualization of pathways involved in breast cancer cell invasiveness. (A) “NCI Syndecan 3 mediated signaling events Main Pathway” (B) “PECAM1_interactions_Main_Pathway”; (C) “reactome Regulation of innate immune responses to cytosolic DNA Main Pathway”; (D) “ILK Signaling Pathway Actin Polymerization Cytoskeletal Reorganization”. The pathway is shown as an interacting network, where green arrows indicate activation, red arrows indicate inhibition. Color depth of each node of the network corresponds to the logarithms of the case-to-normal (CNR) expression rate for each node, where “normal” is expression level in the control group, the scale represents extent of up/downregulation.

