
2.
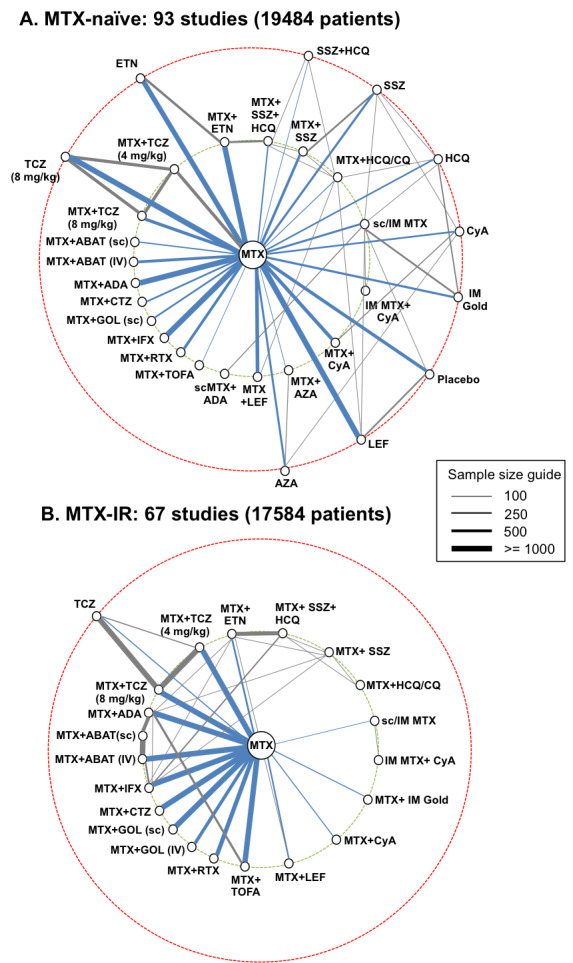
Networks of included studies for methotrexate‐naïve (A) and methotrexate‐inadequate response populations (B). Each line represents a direct comparison between two treatments from one or more trials. The line thickness is directly proportional to the total sample size of all trials for that comparison (line length has no meaning). Biologic/targeted synthetic DMARDs are shown on the left of each network and conventional synthetic DMARDs on the right. Treatments on the innermost circle (green hashed line) are treatments of interest, whereas treatments on the outermost circle (red hashed line) are other treatments that form links between treatments of interest. Comparisons to methotrexate are shown in blue. Two trials were included in both analyses.
Abbreviations: ABAT, abatacept; ADA, adalimumab; AZA, azathioprine; CTZ, certolizumab; CQ, chloroquine; CyA, cyclosporine; ETN, etanercept; GOL, golimumab; HCQ, hydroxychloroquine; IFX, infliximab; IM, intra‐muscular; IV, intravenous; LEF, leflunomide; , methotrexate; RTX, rituximab; sc, subcutaneous; SSZ, sulphasalazine; TCZ, tocilizumab; TOFA, tofacitinib