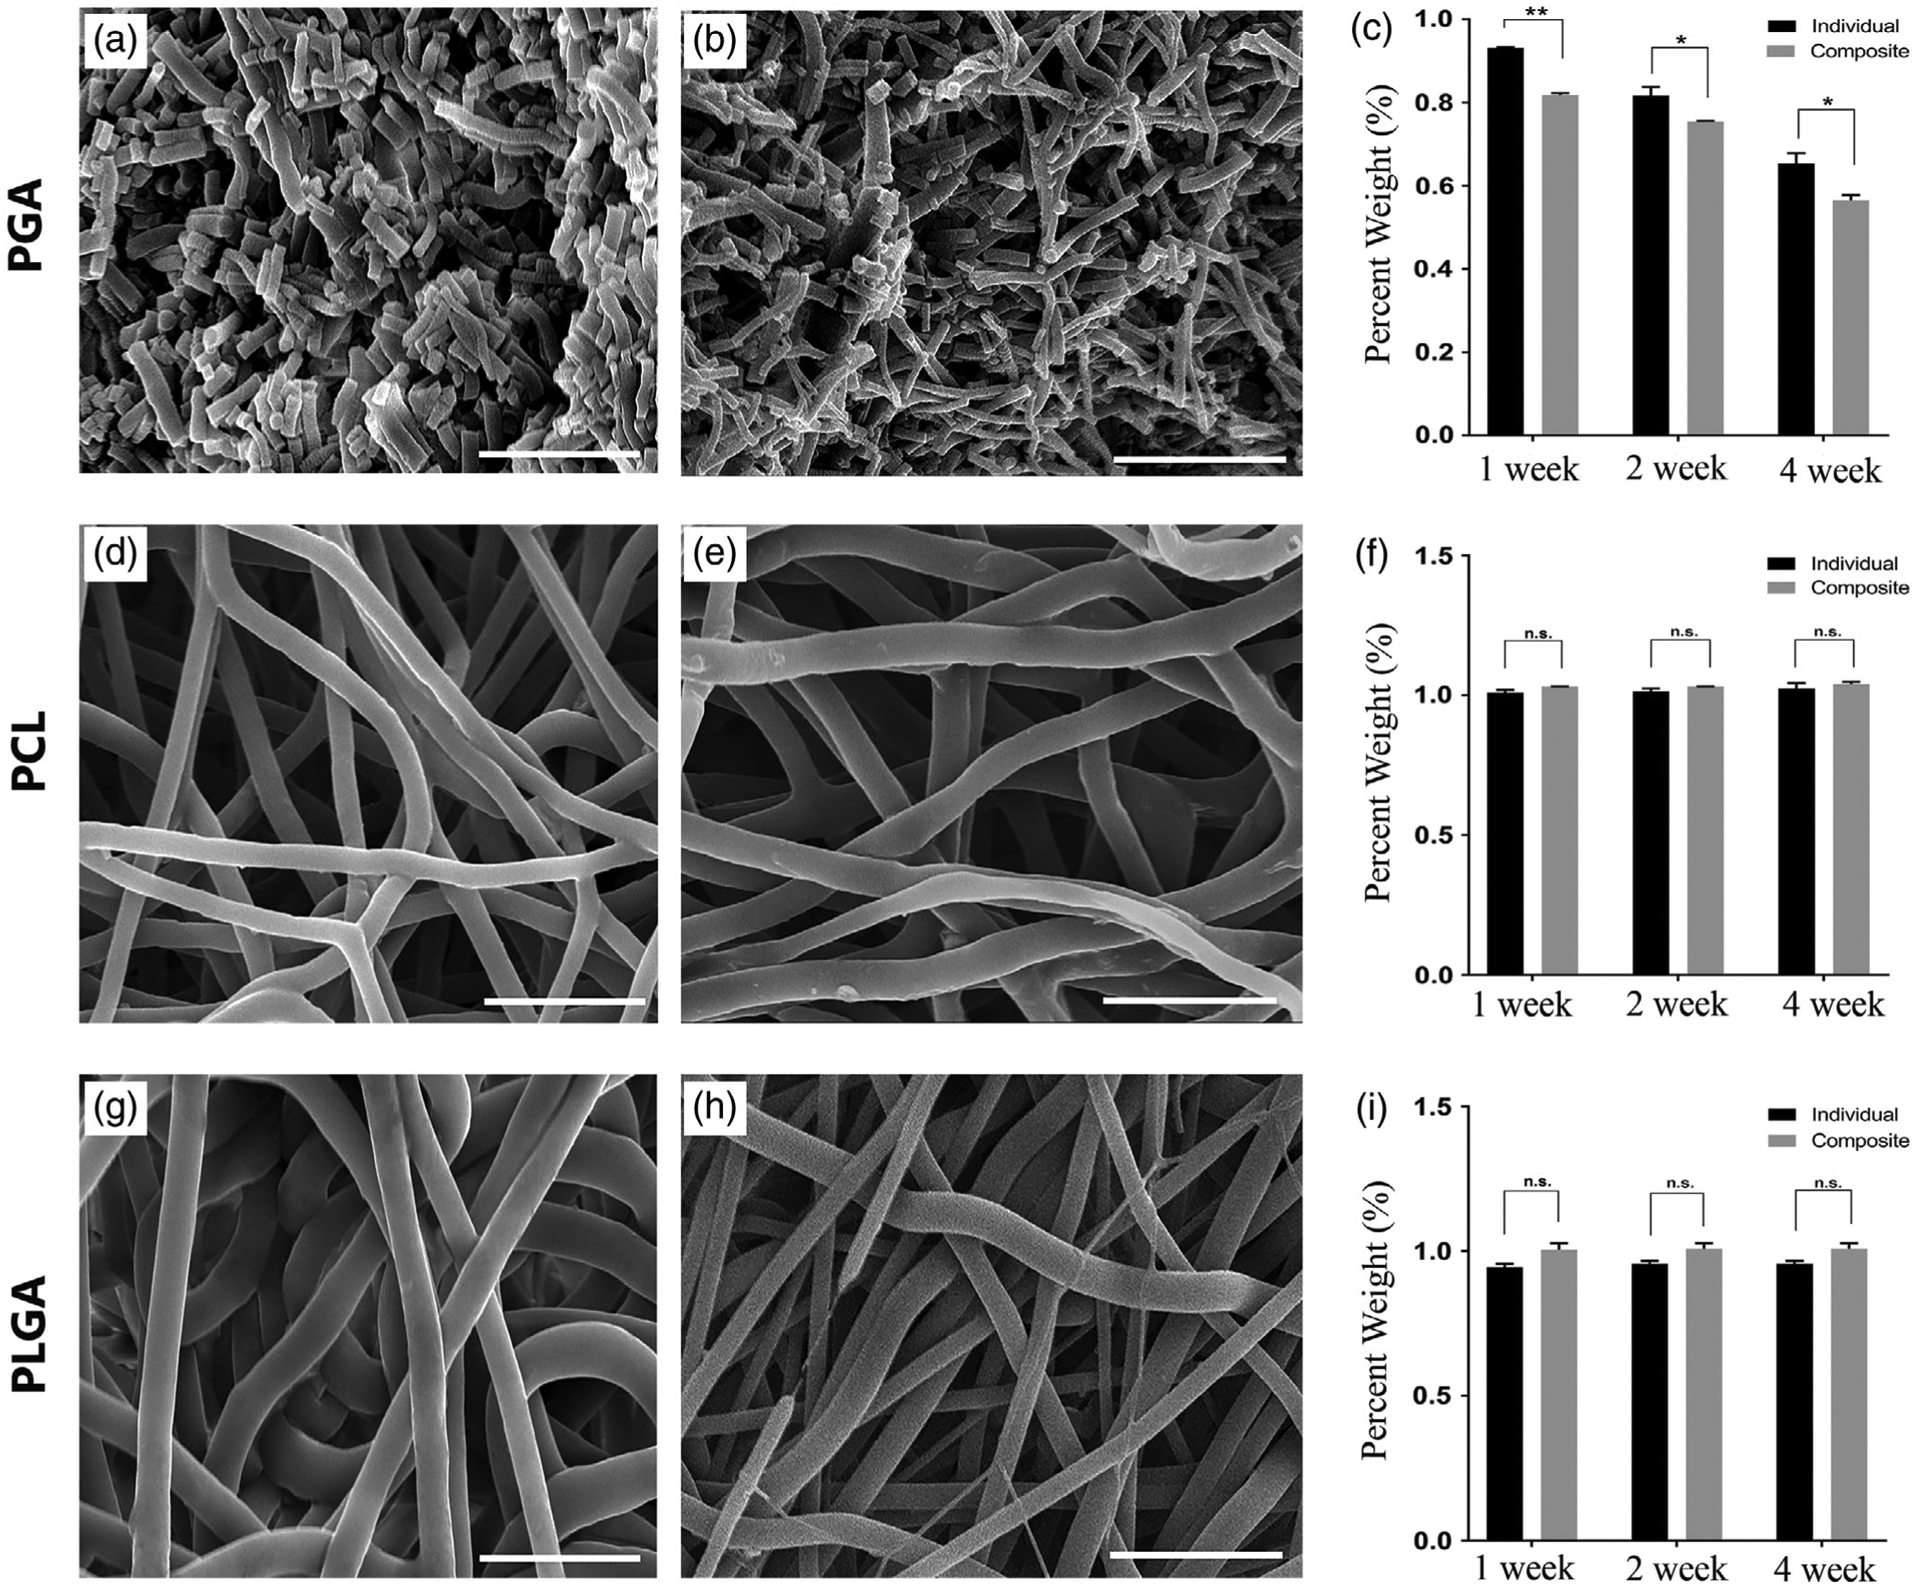
FIGURE 3.

Biodegradation of the electrospun and composite PGA, PCL, and PLGA scaffolds. The first column is SEM images of the electrospun scaffold alone for each polymer at 4 weeks: (a) PGA, (d) PCL, (g) PLGA; the second column is the SEM images of the composite electrospun scaffold after removal of the PEO microparticle at 4 weeks: (b) PGA, (e) PCL, (h) PLGA. The third column is a chart of retained weight of the electrospun or composite scaffold for (c) PGA, (f) PCL, (i) PLGA at time points of 1, 2, and 4 weeks. Scale bar: 15 μm. n.s. is not statistically significant; *Significant difference, p < .05; **Significant difference, p < .01
