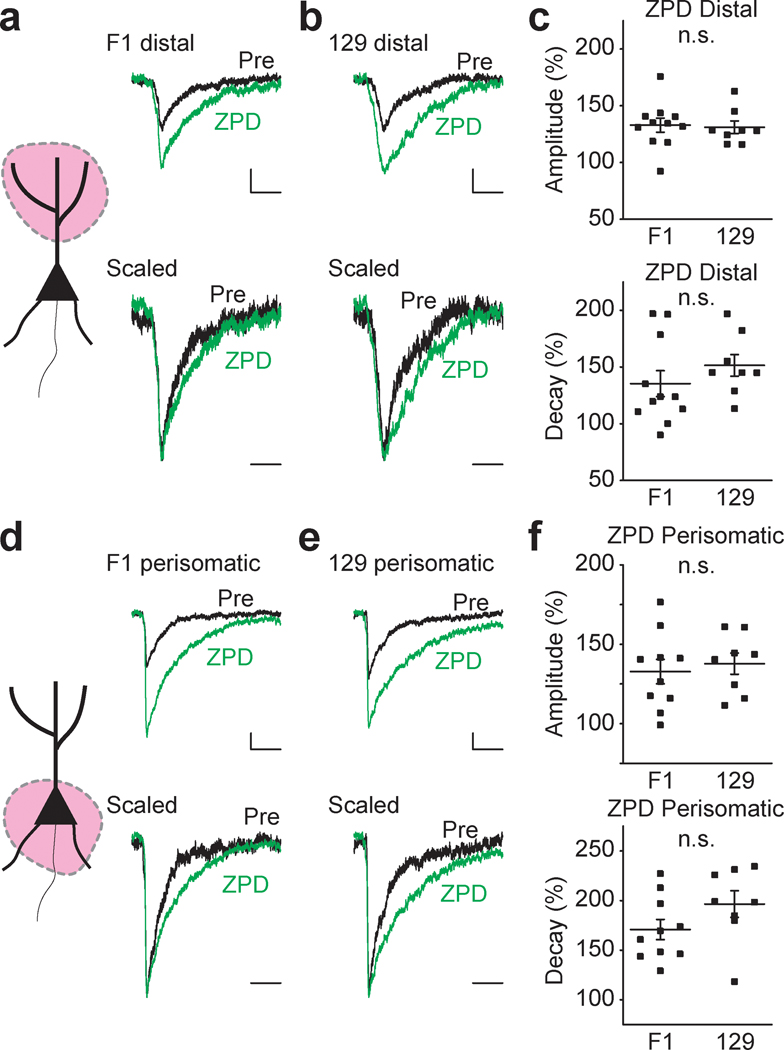
Figure 5 : α1-PAM ZPD potentiates aIPSCs similarly in F1 and 129 strains.
(a – c) ZPD effects on distal aIPSCs. (d – f) ZPD effects on perisomatic aIPSCs. (a) Cartoon representation of the region activated and representative (top) and scaled (bottom) distal aIPSC traces before (Pre) and after ZPD treatment in F1 mice. Calibration: 20 ms, 20 pA. Wilcoxon signed-rank test: Mean amplitude: 42.3 ± 1.7 ms (Pre) and 56.0 ± 3.0 pA (ZPD), p < 0.01; Mean decay time: 9.5 ± 0.4 ms (Pre) and 12.7 ± 0.9 ms (ZPD), p < 0.01; n = 11 cells / 6 mice (grouped data not shown in the figure). (b) Representative (top) and scaled (bottom) distal aIPSC traces before (Pre) and after ZPD treatment in 129 mice. Calibration: 20 ms, 20 pA. Wilcoxon signed-rank test: Mean amplitude: 47.0 ± 2.8 ms (Pre) and 61.6 ± 4.4 pA (ZPD), p < 0.01; Mean decay time: 11.0 ± 0.9 ms (Pre) and 16.6 ± 1.5 ms (ZPD); p < 0.01, n = 8 cells / 4 mice (grouped data not shown in the figure). (c) Grouped data for mean distal aIPSC amplitude (top) and decay time (bottom) after ZPD treatment in F1 and 129 strains. ZPD induced potentiation is comparable in F1 and 129 strains. Mann-Whitney U test: Rerative amplitude: 132.9 ± 6.2 % (F1) and 131.1 ± 5.5 % (129), p = 0.44; Relative decay time: 135.3 ± 11.4 % (F1) and 151.4 ± 9.5 % (129), p = 0.15, n = 11 cells / 6 mice (F1) and 8 cells / 4 mice (129). n.s. denotes p ≥ 0.05. (d) Cartoon representation of the region activated and representative (top) and scaled (bottom) perisomatic aIPSC traces before (Pre) and after ZPD treatment in F1 mice. Calibration: 20 ms, 20 pA. Wilcoxon signed-rank test: Mean amplitude: 51.0 ± 2.6 ms (Pre) and 67.2 ± 4.2 pA (ZPD); Mean decay time: 7.3 ± 0.6 ms (Pre) and 12.3 ± 1.0 ms (ZPD), p < 0.01, n = 10 cells / 6 mice (grouped data not shown in the figure). (e) Representative (top) and scaled (bottom) perisomatic aIPSC traces before (Pre) and after ZPD treatment in 129 mice. Calibration: 20 ms, 20 pA. Wilcoxon signed-rank test: Mean amplitude: 46.8 ± 3.3 ms (Pre) and 64.2 ± 5.0 pA (ZPD); Mean decay time: 7.4 ± 0.8 ms (Pre) and 14.0 ± 1.0 ms (ZPD), p < 0.01, n = 8 cells / 4 mice. (f) Grouped data for mean perisomatic aIPSC amplitude (top) and decay time (bottom) after ZPD treatment in F1 and 129 strains. ZPD induced potentiation is comparable in F1 and 129 strains. Mann-Whitney U test: Relative amplitude: 132.8 ± 7.7 % (F1) and 137.8 ± 6.7 % (129), p = 0.70; Relative decay time: 170.1 ± 10.1 % (F1) and 196.4 ± 13.4 % (129), p = 0.10, n = 10 cells / 6 mice (F1) and 8 cells / 4 mice (129). n.s. denotes p ≥ 0.05.

