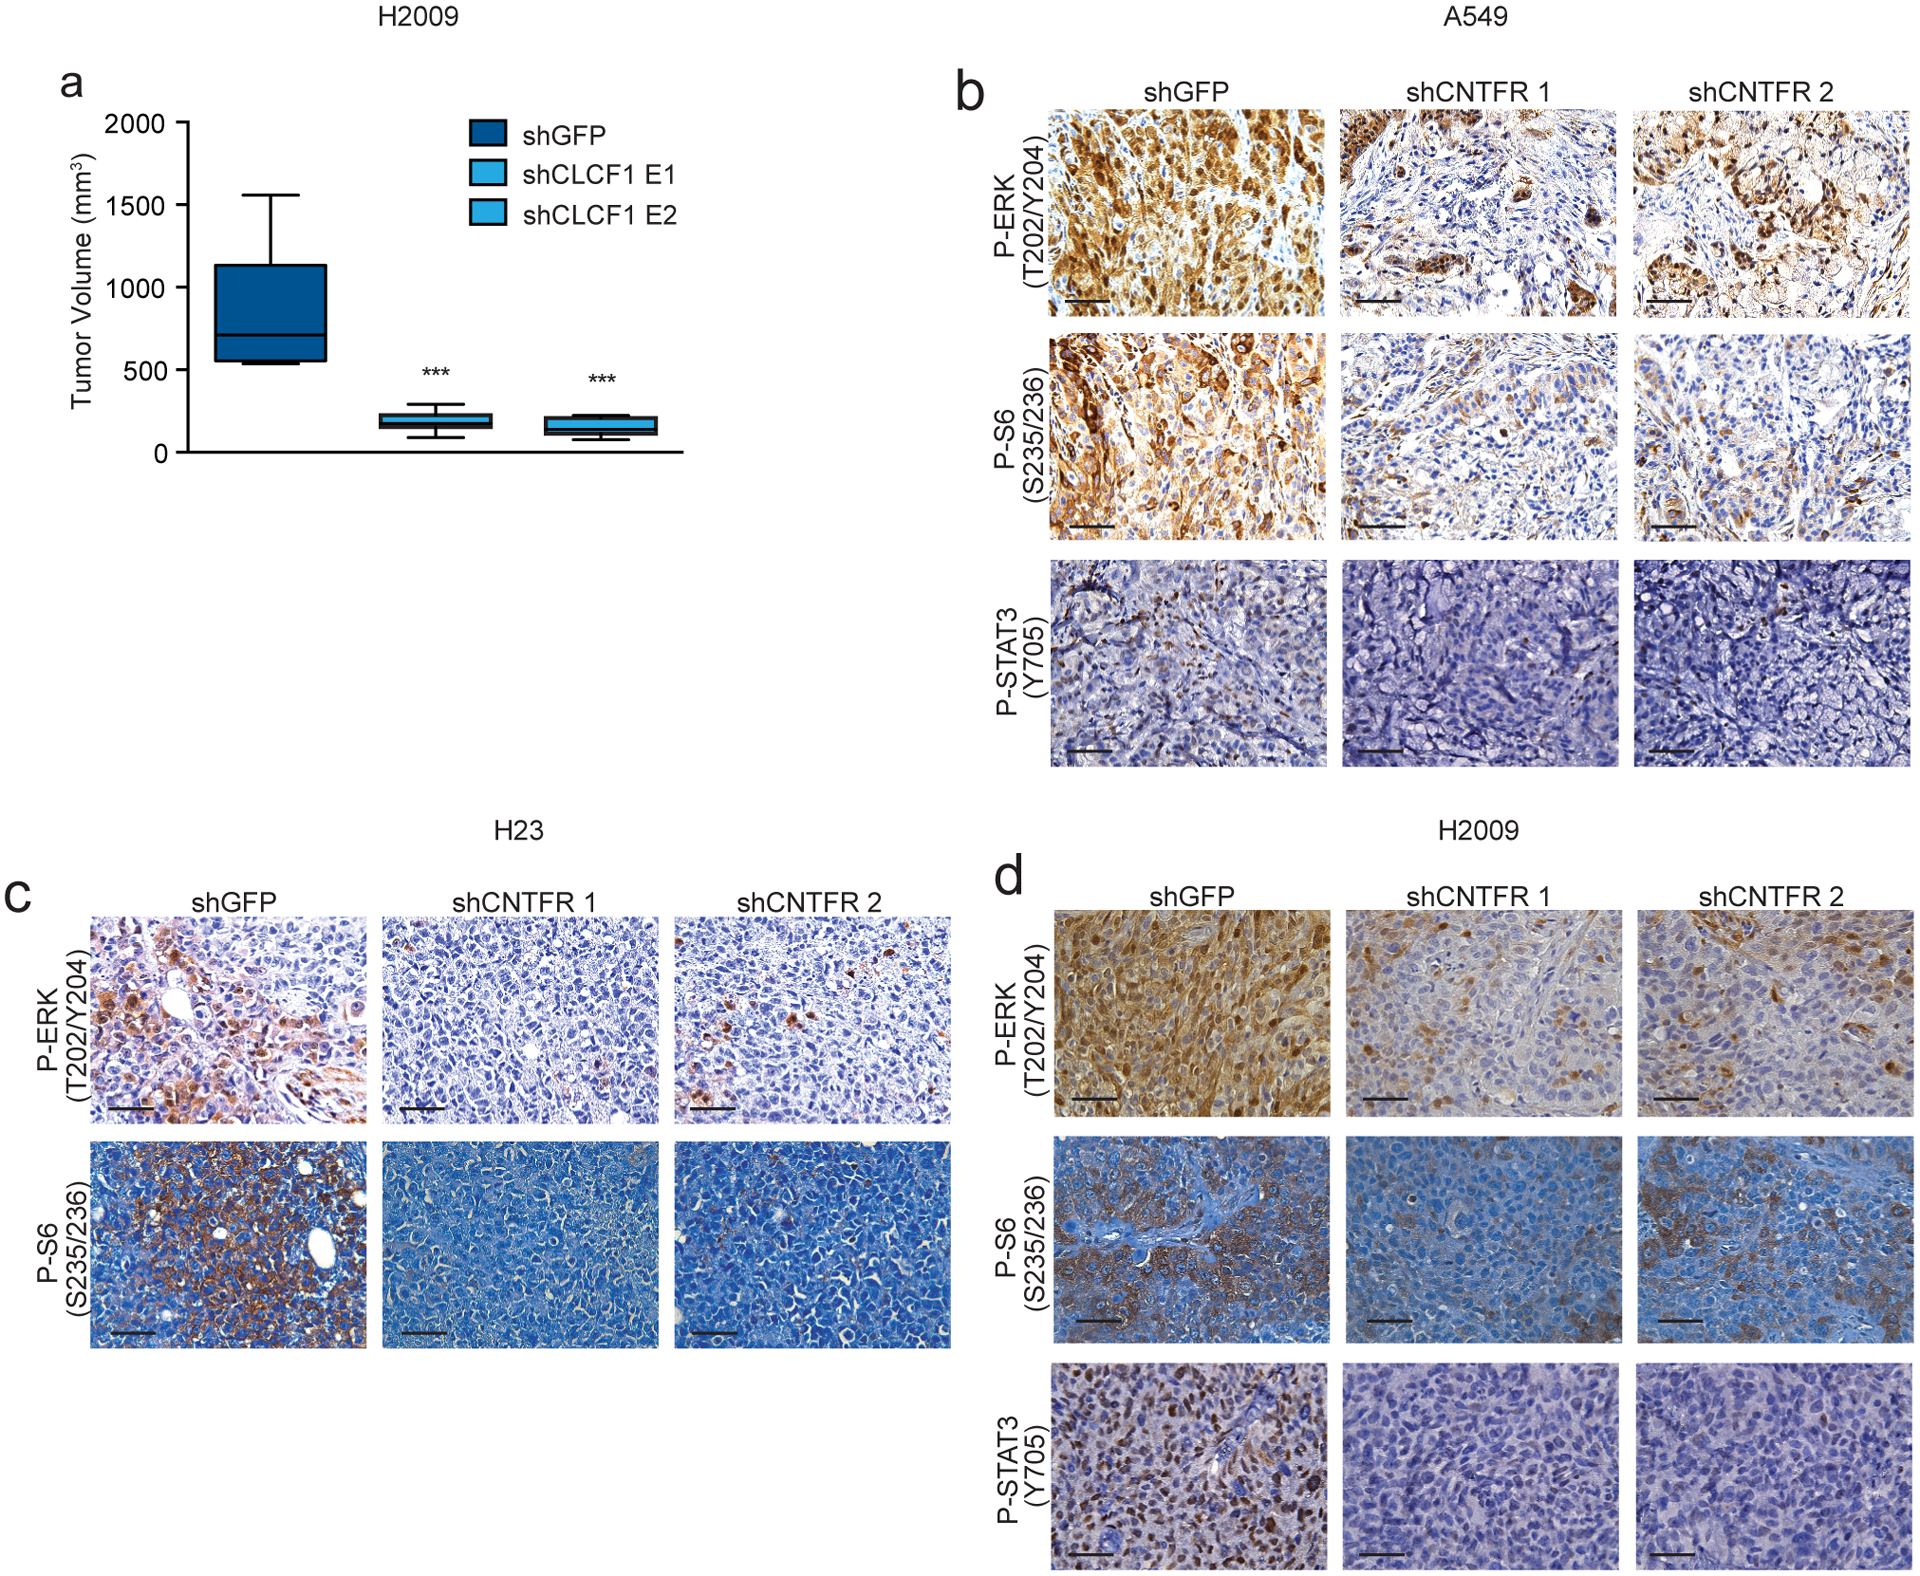
Extended Data Figure 5:

CLCF1 knockdown decreases tumor growth and CNTFR knockdown decreases ERK, S6, and STAT3 signaling in vivo. (a) Tumor volume quantification of final time point of H2009 xenografts with indicated shRNAs (n = 8 biologically independent samples). *** P < 0.001 using one-way ANOVA and Dunnett’s multiple comparison test (DMCT). Whiskers identify the maximum and minimum values; boxes indicate the 75th and 25th percentile and the line the median. (b-d) Representative IHC for phospho-ERK (P-ERK), Phospho-S6RP (P-S6), and phospho-STAT3 (P-STAT3) from A549, H23, and H2009 xenografts. Note: P-STAT3 baseline levels were below the level of detection for H23 (n = 3 independent experiments with similar results). Scale bars, 50 μm.
