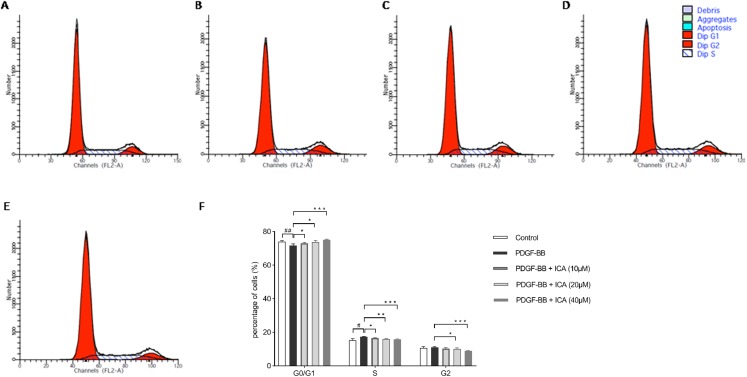
Figure 2. Effects of ICA on the cell cycle progression of PDGF-BB-stimulated RPE cells after 48 h.
Cell cycle was determined by individual nuclear DNA content reflected by fluorescence intensity of incorporated PI. Percentage of cells in G0/G1, S and G2/M phases were calculated. Represent images of cell cycle in (A) Control; (B) PDGF-BB; (C) PDGF-BB + ICA (10 µM); (D) PDGF-BB + ICA (20 µM) and (E) PDGF-BB + ICA (40 µM); (F) bar graphs show the percentage of cells at each stage. Data are expressed as mean ± SD (n = 3). #P < 0.05, ##P < 0.01 vs. control group; *P < 0.05, **P < 0.01, ***P < 0.001 vs. PDGF-BB group.

