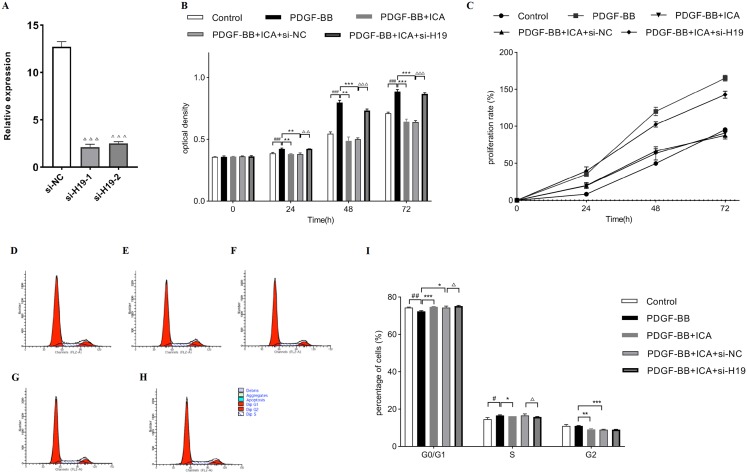
Figure 5. Down-expression of H19 reversed ICA-induced cell proliferation in PDGF-BB-stimulated RPE cells.
(A) Transfected efficiency of si-H19 or si-NC on H19 expression was detected by qPCR in RPE cells. (B) Cell proliferation of ICA-treated RPE cells with si-H19 or si-NC transfection was measured by MTS assay at 0, 24, 48 and 72 h. Bar graphs show the OD of all groups. (C) The cellular proliferating ability was assessed by the proliferation curve. (D–H) The distribution of cell cycle in RPE cells with si-H19 or si-NC transfection was assessed by flow cytometry; (D) Control group; (E) PDGF-BB group; (F) PDGF-BB + ICA group; (G) PDGF-BB + ICA + si-NC group; (H) PDGF-BB + ICA + si-H19 group. (I) Bar graphs show the percentage of cells at each stage (n = 3). OD, optical density. Control: blank control group without PDGF-BB; PDGF-BB: 20 ng/ml PDGF-BB; PDGF-BB + ICA: 20 ng/ml PDGF-BB + 40 µM ICA; PDGF-BB + ICA + si-NC: 20 ng/ml PDGF-BB + 40 µM ICA + si-NC; PDGF-BB + ICA + si-H19: 20 ng/ml PDGF-BB + 40 µM ICA + si-H19. OD, optical density. Data are expressed as mean ± SD. #P < 0.05, ##P < 0.01, ###P < 0.001 vs. control group; *P < 0.05, **P < 0.01, ***P < 0.001 vs. PDGF-BB group; ΔP < 0.05, ΔΔP < 0.01, ΔΔΔP < 0.001 vs. PDGF-BB + ICA + si-NC group.

