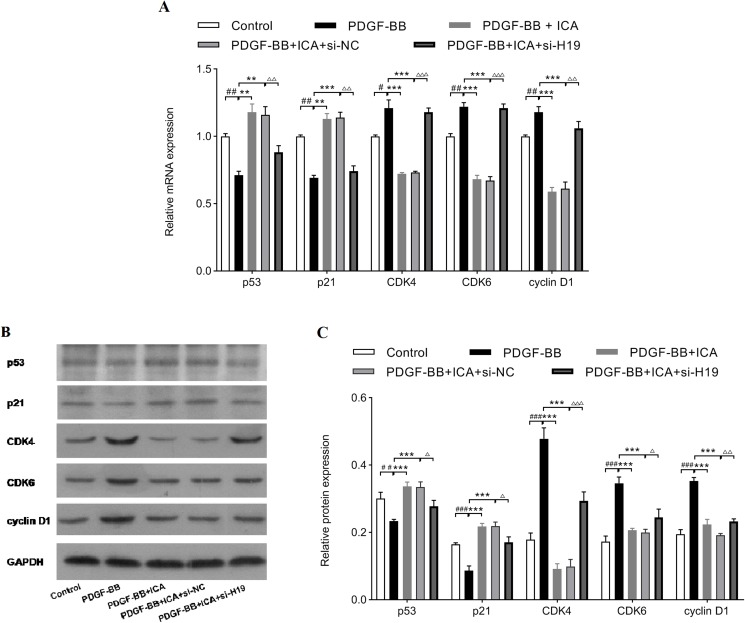
Figure 6. Down-expression of H19 reversed ICA-induced changes in cell cycle-related factors expression.
The mRNA levels determined by qPCR (A), and the protein levels detected by western blot assay (B and C). Data are expressed as mean ± SD (n = 3). #P < 0.05, ##P < 0.01, ###P < 0.001 vs. control group; **P < 0.01, ***P < 0.001 vs. PDGF-BB group; ΔP < 0.05, ΔΔP < 0.01, ΔΔΔP < 0.001 vs. PDGF-BB + ICA + si-NC group.

