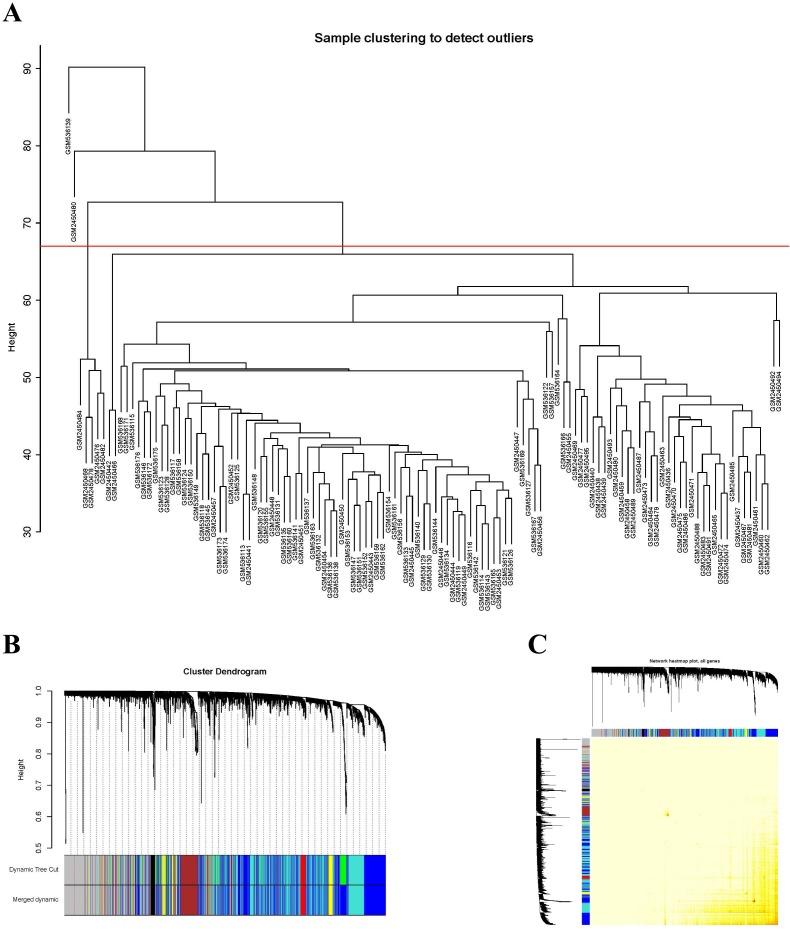
Figure 1. Sample clustering to detect outliers and construction of coexpression modules.
(A) Hierarchical clustering of the top 5,000 genes with the highest average expression values of MCL samples in the clustering analysis. There were two outlier samples in the total 123 samples, that are GSM536139 and GSM2450480, when the threshold value was determined as 67 (red line). (B) The constructed coexpression modules of MCL genes by WGCNA software. (C) Interaction analysis between gene coexpression modules. The heatmap showed the Topological Overlap Matrix (TOM) among genes in the analysis. Different colors on the x-axis and y-axis represented different modules. The yellow brightness of the middle part represented the strength of connections between modules.

