
Fig. 2.
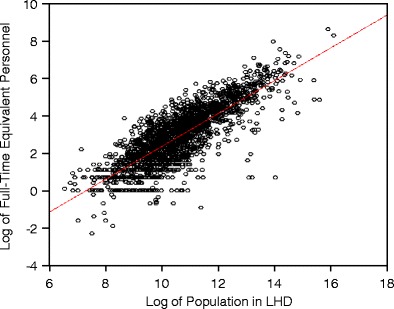
Scatter Diagram of Relationship between Population (in logs) serviced by each of the 1,972 LHDs and Full-Time Equivalent Personnel (also in logs)
Official websites use .gov
A
.gov website belongs to an official
government organization in the United States.
Secure .gov websites use HTTPS
A lock (
) or https:// means you've safely
connected to the .gov website. Share sensitive
information only on official, secure websites.
Scatter Diagram of Relationship between Population (in logs) serviced by each of the 1,972 LHDs and Full-Time Equivalent Personnel (also in logs)