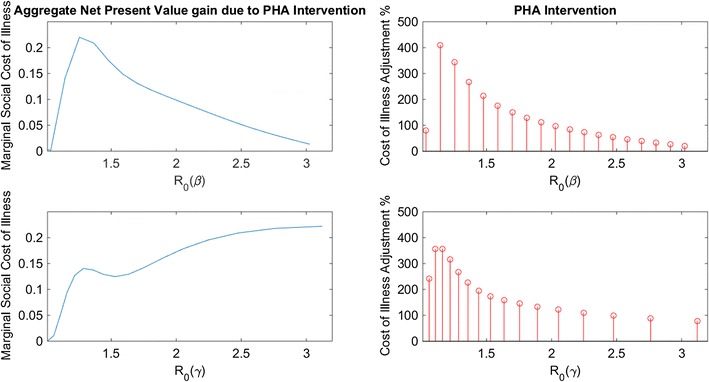
Fig. 4.

On the left is the aggregate net present value that PHA intervention induces and on the right is the actual amount of PHA intervention. Each are a function of R 0 which is depicted as a function of β on the top two panels and as a function of γ on the bottom two panels.
