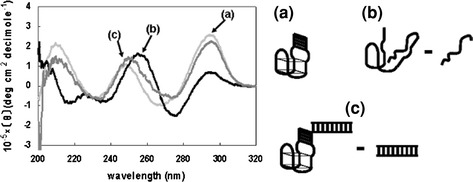
Fig. 4.

CD spectra of AES invA 3′27. Oligonucleotides at a concentration of 25 μM were used. Thrombin-inhibiting aptamer (a), CD spectrum of the probe DNA subtracted from that of AES invA 3′27 (b), CD spectrum of the probe DNA hybridized with the 27-mer invA subtracted from that of AES invA 3′27 hybridized with the 27-mer invA (c). The CD spectra were measured using a 0.1-cm path-length cuvette at 25°C
