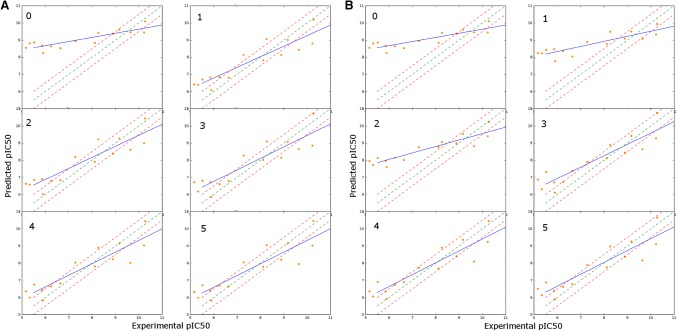
Fig. 3.
Evolution of the models for each iteration in the HIV-PR simulation. a Pool of regressors. b Random selection. Green lines represent y = x; red lines mark ± 0.5 units from the green line (y = x + 0.5 and y = x-0.5); The resulting regression between the predicted values for the samples (orange dots) and the experimental values is plotted in blue

