
Fig. 1.
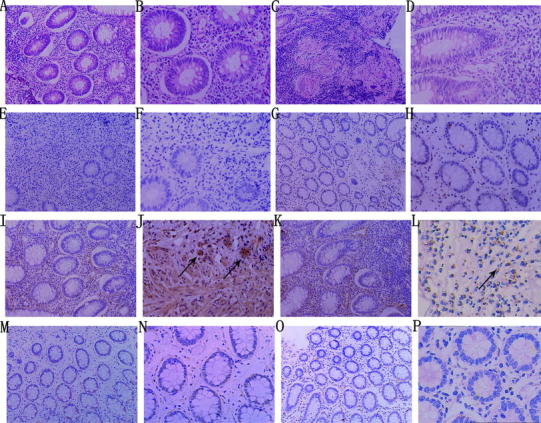
Representative photographs of hematoxylin–eosin (HE) staining and immunohistochemical staining of FGL2 in mucosal biopsy tissues. a–d HE staining of tissues from patients with UC and CD; a large number of monocytes and neutrophils infiltrating the intestinal tissues were observed (a UC ×200, b UC ×400, c CD ×200, d CD ×400). e, f Negative controls showed no positive expression of FGL2 (e ×200, f ×400). g, h Normal controls showed little or no FGL2 expression (g ×200, h ×400). i–l FGL2 was strongly expressed in inflammatory infiltrating cells and endothelial cells (black arrows) of tissues from patients with active UC or CD (i active UC ×200, j active UC ×400, k active CD ×200, l active CD ×400). m–p Expression of FGL2 was less in patients with inactive UC or CD (m inactive UC ×200, n inactive UC ×400, o inactive CD ×200, p inactive CD ×400)