
Table 3.
Performance of anti-MERS-CoV antibody tests in epidemiologic surveillance of MERS-CoV infection
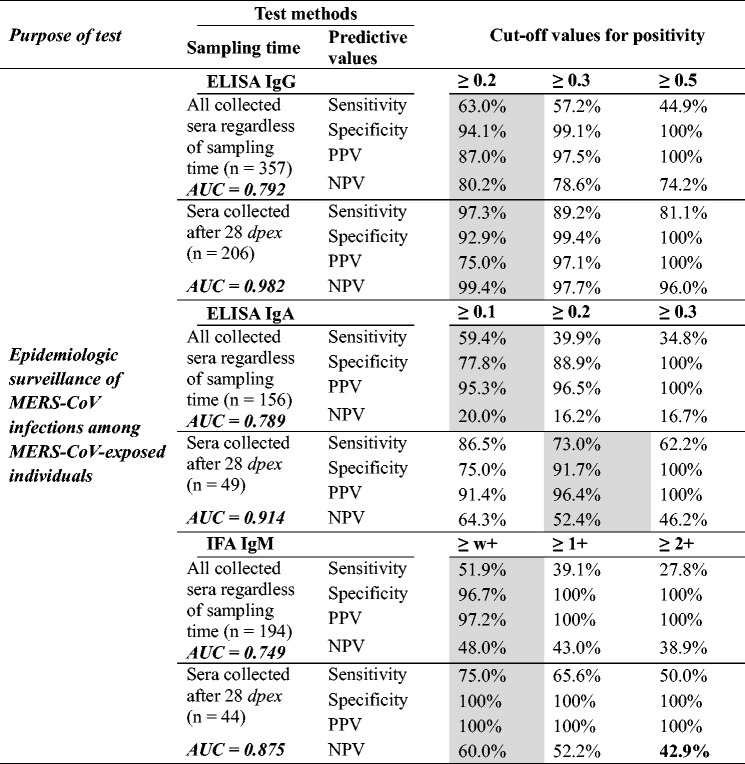
Data are expressed as a percentage of each predictive value according to various cut-off values. Cut-off values with optimal sensitivity and specificity analyzed per 0.1 OD ratio (ELISA) or IFA intensity are presented as gray-scale. AUCs were calculated from the ROC curve. The population this analysis is 268 MERS-CoV-exposed individuals (Table 1). Diagnosis of MERS-CoV infection was confirmed by positive rRT-PCR assay of respiratory specimens.
MERS-CoV Middle East respiratory syndrome coronavirus, ELISA enzyme-linked immunosorbent assay, AUC area under the curve, PPV positive predictive value, NPV negative predictive value, dpex days post exposure, IFA immunofluorescence assay, w+ weak positive, OD optical density, ROC receiver operating characteristic, rRT-PCR real-time reverse transcriptase polymerase chain reaction