
Fig. 2.
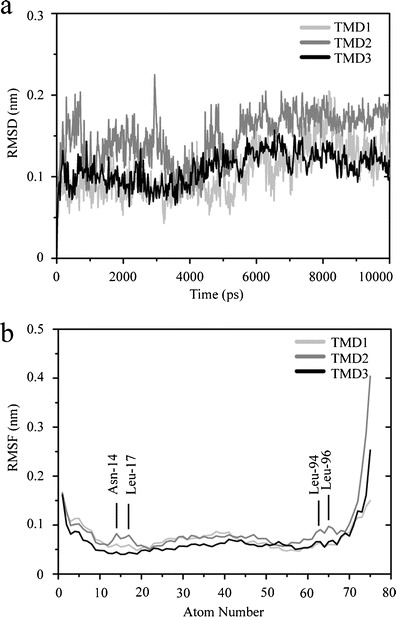
Root mean square deviation (RMSD) of the Cα backbones of the single TMDs, TMD1, TMD2 and TMD3, referring to the respective starting structure (a). Root mean square fluctuation (RMSF) of the atoms of the amino acids (b). The TMDs are overlaid so that the atom numbers match for each TMD. Values for TMD1 are shown in light gray, those for TMD2 in gray and the values for TMD3 in black