
Fig. 5.
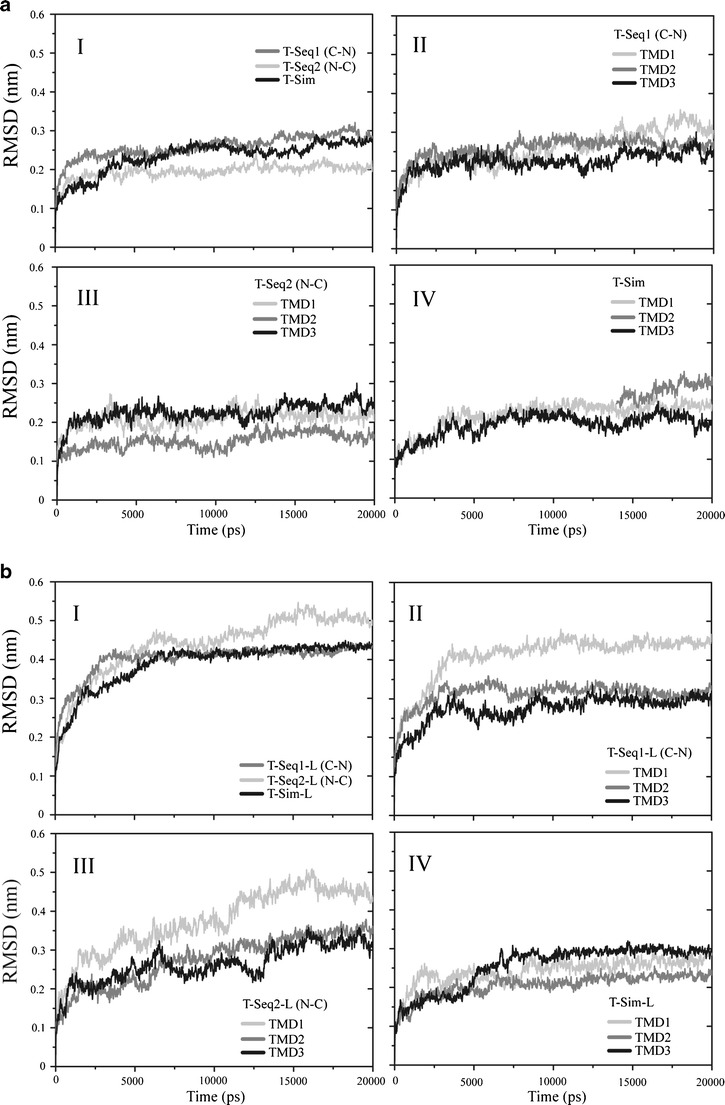
Root mean square deviation (RMSD) of the of Cα backbones of the bundle structures referring to the starting structure. T-Seq1 (gray), T-Seq2 (light gray) and T-Sim are shown (aI). The respective RMSD values for the individual TMDs of each simulation (TMD1 in light gray, TMD2 in gray, TMD3 in black) are shown separately (aII-IV). RMSD values of the bundles including the loops are shown for T-Seq1-L, TSeq2-L and T-Sim-L (b). Color coding and arrangement of the panels like in (a)