Fig. 6.

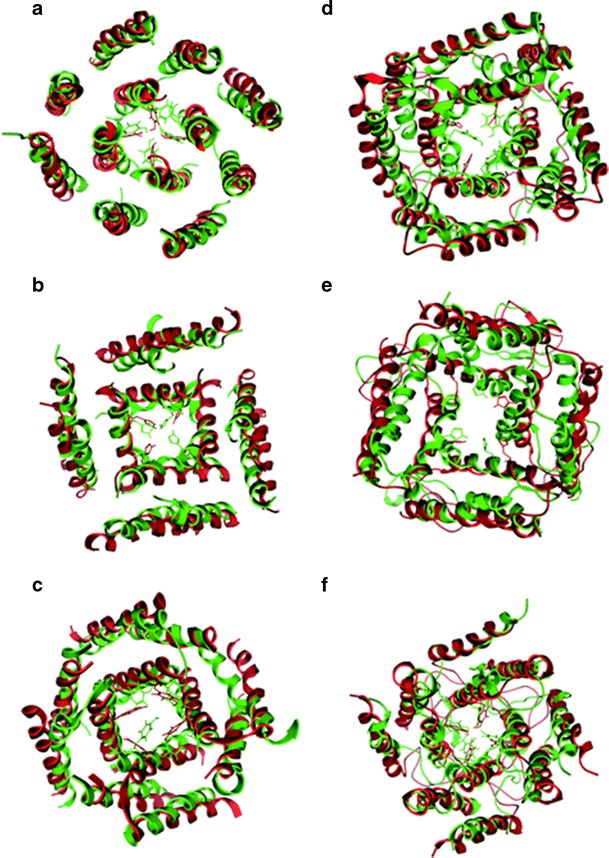
Models of T-Seq1 (a), T-Seq2 (b) and T-Sim (c), T-Seq1-L (d), T-Seq2-L (e) and T-Sim-L (f) are shown in their starting conformation (green) and after 20 ns of MD simulation (red)

Models of T-Seq1 (a), T-Seq2 (b) and T-Sim (c), T-Seq1-L (d), T-Seq2-L (e) and T-Sim-L (f) are shown in their starting conformation (green) and after 20 ns of MD simulation (red)