
Fig. 7.
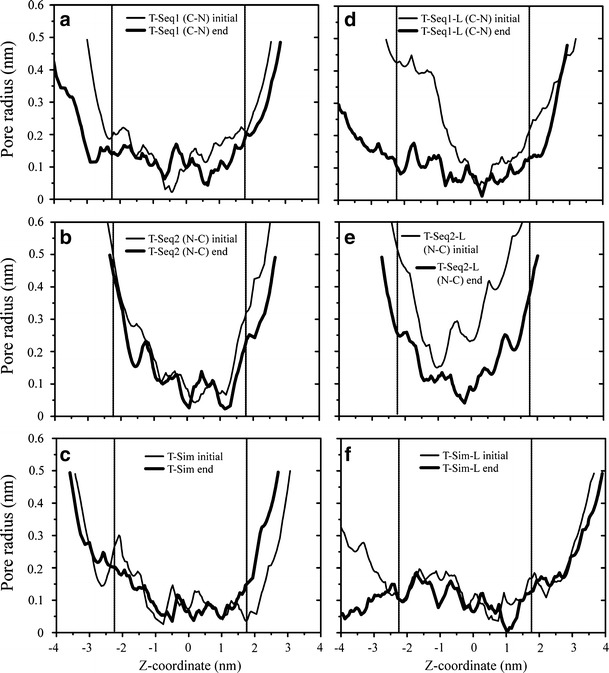
Pore radii calculated using the software HOLE [56]. The values of the first 25 structures, covering 500 ps simulation in steps of 20 ps, are averaged and depicted in light lines. A similar average has been calculated covering the last 500 ps of the simulations (thick lines). Models of T-Seq1 (a), T-Seq2 (b) and T-Sim (c), T-Seq1-L (d), T-Seq2-L (e) and T-Sim-L (f) are shown