Fig. 1.

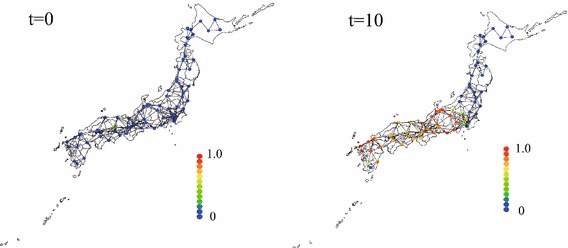
Fraction of infected individuals at 69 nodes (major cities) in Japan at , 10 and 20. which are calculated by SIR model. Each nodes are connected when the distance between two nodes are less than the critical value

Fraction of infected individuals at 69 nodes (major cities) in Japan at , 10 and 20. which are calculated by SIR model. Each nodes are connected when the distance between two nodes are less than the critical value