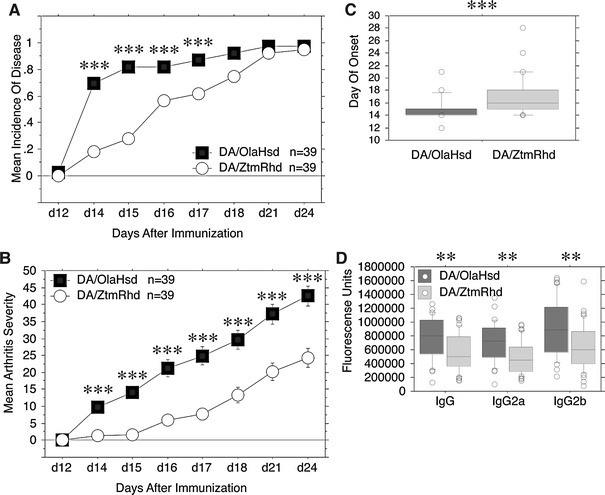
Fig. 3.

Collagen II-induced arthritis in DA/OlaHsd and DA/ZtmRhd rats. (a) Mean of disease incidence in DA/OlaHsd (n = 39) and DA/ZtmRhd (n = 39) rats after injection of 75 μg collagen type II. Data from two independent experiments were pooled and shown as mean of arthritis incidence. All significant p values between DA/OlaHsd and DA/ZtmRhd are indicated (* p < 0.05, ** p < 0.001, *** p < 0.0001). (b) Arthritis severity is shown as mean ± SEM of clinical arthritis score. All animals were included. DA/OlaHsd rats developed significantly more severe CIA than DA/ZtmRhd rats. (c) Day of onset. The days where the first macroscopic signs of arthritis were observed are shown as boxplots. Each box represents the second and third quartiles (from the 25th to 75th percentiles) of all values. Bold lines inside the boxes highlight the median value (50th percentile). Lines outside the boxes represent the 10th and 90th percentiles. Outlines (°) are indicated. DA/OlaHsd (n = 38) had a significantly earlier onset of arthritis than DA/ZtmRhd (n = 37). (d) Anti-CII antibodies in DA substrains after CIA are shown as relative fluorescence units measured in Eu3+LISA. Data are shown as boxplots. DA/OlaHsd rats had significantly higher levels of total anti-CII-IgG, anti-CII-IgG2a, and anti-CII-IgG2b
