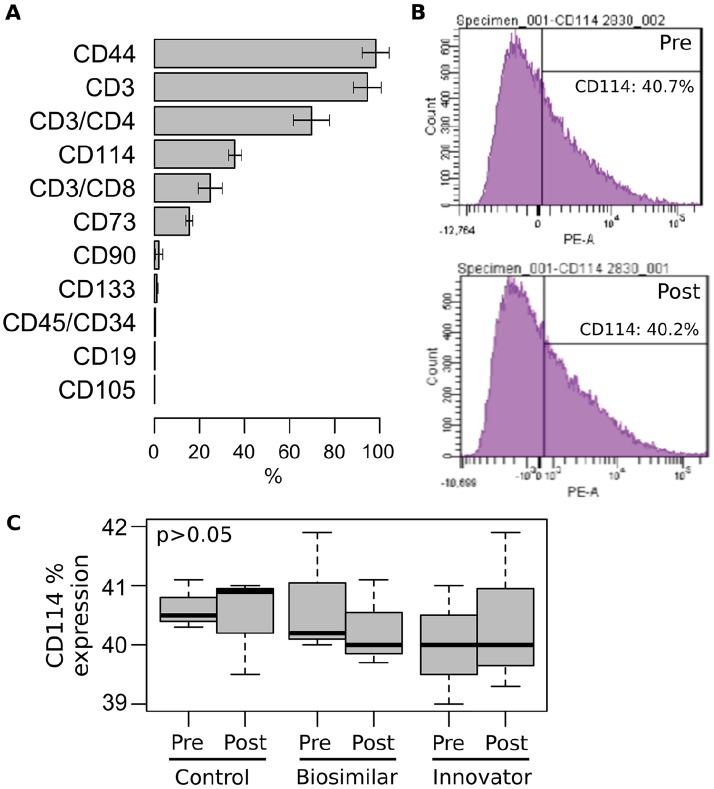
Figure 1.
Surface markers analysis of UBC-derived MNCs. (A) Flow cytometry analysis of 12 different surface markers. The average percentage of expression (±SD) for the UBC samples are shown. (B) Flow cytometry analysis of CD114 expression. (C) Comparative analysis of CD114 expression among UBC-derived MNCs pre- and post-stimulated with biosimilar and innovator G-CSF. Experiments were performed in triplicate and compared with Mann-Whitney test. G-CSF indicates granulocyte-colony-stimulating factor; MNC, mononuclear cells; UBC, umbilical cord blood cells.

