Fig. 1.

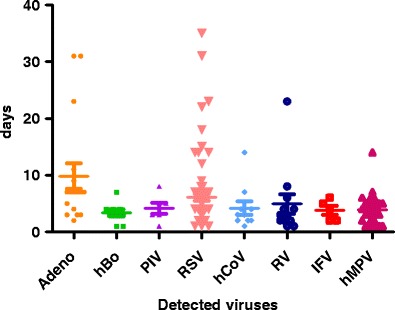
Elapsed time differences between initial symptom presentation and nasopharyngeal samplings in each of the viruses. The bars represent mean values with 95% confidence intervals

Elapsed time differences between initial symptom presentation and nasopharyngeal samplings in each of the viruses. The bars represent mean values with 95% confidence intervals