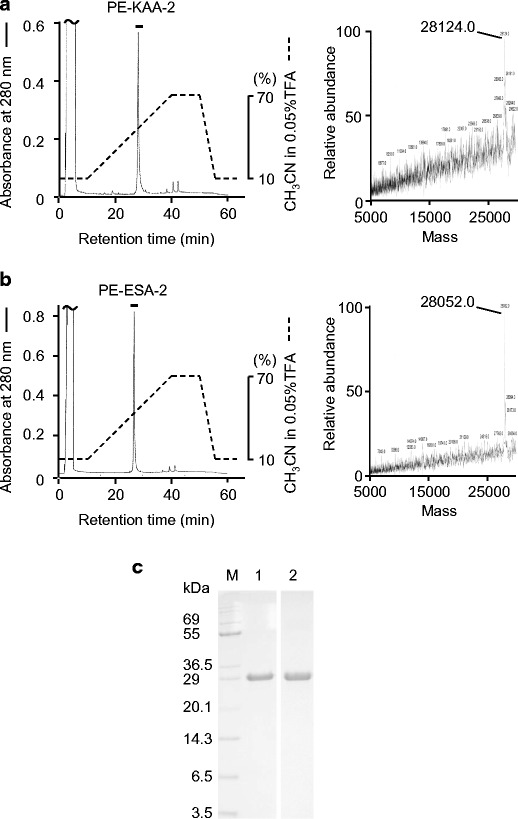
Fig. 2.

Isolation of PE-KAA-2 and PE-ESA-2 by reverse-phase HPLC. PE-KAA-2 (a) and PE-ESA-2 (b) were purified by RP-HPLC on YMC-Pack PROTEIN-RP column. The eluate was monitored by absorbance at 280 nm, and the active fraction represented by a bar was recovered. Deconvoluted mass spectra of purified PE-KAA-2 (a) and PE-ESA-2 (b) using ESI-MS (LCQ) are also represented. SDS-PAGE of PE-KAA-2 (lane 1) and PE-ESA-2 (lane 2) (c). Five micrograms of protein was loaded in each lane. M molecular weight marker
