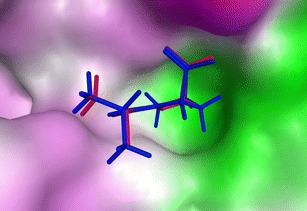
Fig. 2.

Comparison of the re-docked conformation of AP with the crystallographic conformation in the CypA/AP complex. Blue Re-docked conformation, red crystallographic conformation. The root mean squared deviation (RMSD) between the two conformations was as low as 0.261 Å. The surface of the receptor is colored according to lipophilicity. Green Hydrophobic areas, pink hydrophilic areas
