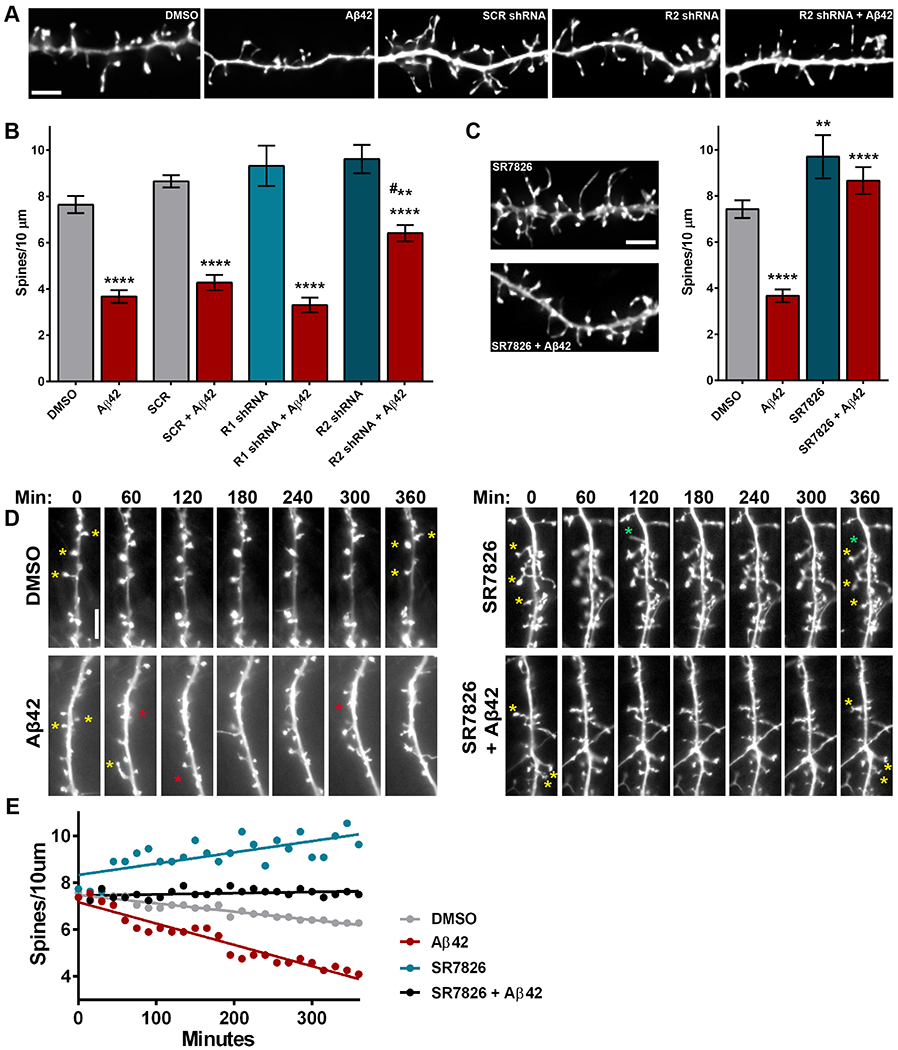
Figure 2. Aβ-induced dendritic spine degeneration is mediated by the ROCK2-LIMK1 pathway.

(A) Representative maximum-intensity widefield fluorescent images of hippocampal neurons after deconvolution. Scale bar, 5 μm. N=9-17 neurons (one dendrite per neuron) were analyzed per experimental condition in 3 independent cultures. (B) Dendritic spine density in hippocampal neurons transduced with lentivirus expressing scramble (SCR) or ROCK1- (R1), or ROCK2 (R2)-targeted shRNA and exposed to DMSO or oligomeric Aβ42 (500 nM). Data are means ± SEM of 3 experiments. ****P<0.0001 (Aβ42 vs DMSO controls) and **P<0.001 (vs SCR+Aβ42, # actual P=0.0069) by one-way ANOVA with Sidak’s test. (C) Representative maximum-intensity widefield fluorescent images (after deconvolution) of hippocampal neurons exposed to SR7826 (10 μM) with or without Aβ42 (500 nM). Scale bar, 5 μm. Data (right) are means ± SEM of 3 experiments; N=6–17 neurons (one dendrite per neuron) were analyzed per experimental condition in 3 independent cultures. ****P<0.0001 and **P<0.01 (actual P=0.0072) by one-way ANOVA with Sidak’s test. (D) Representative widefield live-cell fluorescent images of hippocampal neurons over time, exposed to DMSO, Aβ42, SR7826, or SR7826 + Aβ42. Stars highlight loss (red), maintenance (yellow), or formation (green) of dendritic spines. Scale bar, 5 μm. (E) Representative spine density counts in hippocampal neurons over 6 hours with the indicated treatments. Dots represent the spine density (spines per 10 μm) for a single dendrite at 15 minute intervals over 6 hours. N=3–5 neurons (one dendrite per neuron) were analyzed per experimental condition in 3 independent cultures Related data are shown in fig. S2.
