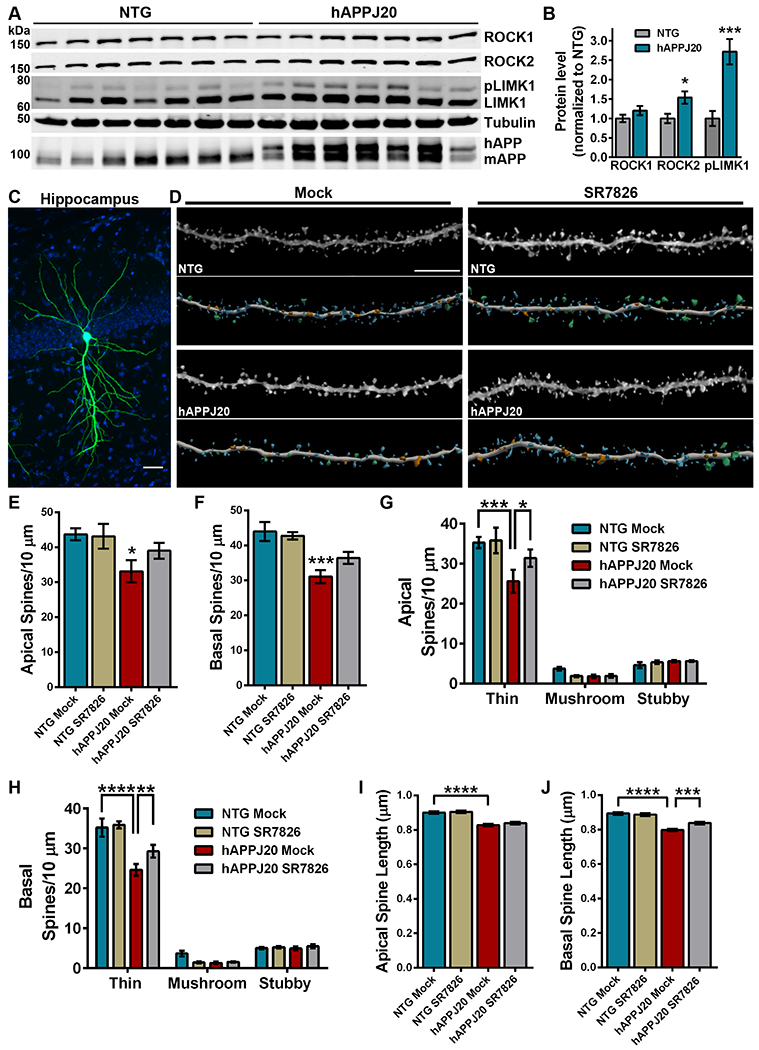
Figure 4. LIMK1 inhibition rescues hippocampal thin spine loss in hAPP mice.

(A and B) Representative immunoblots (A) and densitometry analysis (B) of ROCK2 and phosphorylated LIMK1 protein abundance in the hippocampus of hAPPJ20 mice relative to each in non-transgenic (NTG) littermates. For densitometry, pLIMK1 was normalized to levels of LIMK1. Immunoblot for amyloid precursor protein (APP) identifies human APP in hAPPJ20 mice. Data are means ± SEM of 7 mice (3 males and 4 females per genotype). *P<0.05 (actual P=0.0191) and ***P<0.001 (actual P=0.0007) by an unpaired t-test. (C) Representative maximum-intensity image of a CA1 pyramidal neuron in the hippocampus iontophoretically-filled with Lucifer yellow. Blue signal is DAPI. Scale bar, 50 μm. (D) Representative maximum-intensity high-resolution confocal microscope images of dye-filled dendrites, from mock- or SR7826-treated hAPPJ20 and NTG mice, after deconvolution and corresponding three-dimensional digital reconstruction models of dendrites. Scale bar, 5 μm. Colors in digital reconstructions correspond to dendritic protrusion classes: blue represents thin spines; orange, stubby spines; green, mushroom spines; and yellow, dendritic filopodia. (E and F) Mean number of apical (E) and basal (F) spines per 10 μm in dendrites from mock- or SR7826-treated hAPPJ20 and NTG mice. Data are means ± SEM. The apical dendrite conditions are as follows: N=26 dendrites from 5 NTG mock mice (3 females, 2 males), N=26 dendrites from 5 NTG SR7826 mice (1 female, 4 males), N=33 dendrites from 5 hAPPJ20 mock mice (2 females, 3 males), and N=30 dendrites from 5 hAPPJ20 SR7826 mice (2 females, 3 males) for a total of 3,546 μm analyzed. The basal dendrite conditions are as follows: N=22 dendrites from 5 NTG mock mice (3 females, 2 males), N=23 dendrites from 5 NTG SR7826 mice (1 female, 4 males), N=26 dendrites from 5 hAPPJ20 mock mice (2 females, 3 males), and N=26 dendrites from 5 hAPPJ20 SR7826 mice (2 females, 3 males) for a total of 3,126 μm analyzed. *P<0.05 (actual P=0.0313) and ***P<0.001 (actual P=0.0005) by one-way ANOVA with Sidak’s test. (G and H) Mean number of thin, stubby, or mushroom spines per 10 μm of apical (G) or basal (H) dendrites from mock- or SR7826-treated hAPPJ20 and NTG mice. Data are means ± SEM; N as given in (E and F). *P<0.05 (actual P=0.0398), **P<0.01 (actual P=0.0098), ***P<0.001 (actual P=0.0002), and ****P<0.0001 by two-way ANOVA with Tukey’s test. (I and J) Mean spine length of apical (I) and basal (J) spines among CA1 pyramidal neurons in the hippocampus from mock- or SR7826-treated hAPPJ20 and NTG mice. Data are means ± SEM; N as given in (E and F). ***P<0.001 (actual P=0.0003) and ****P<0.0001 by one-way ANOVA with Sidak’s test.
