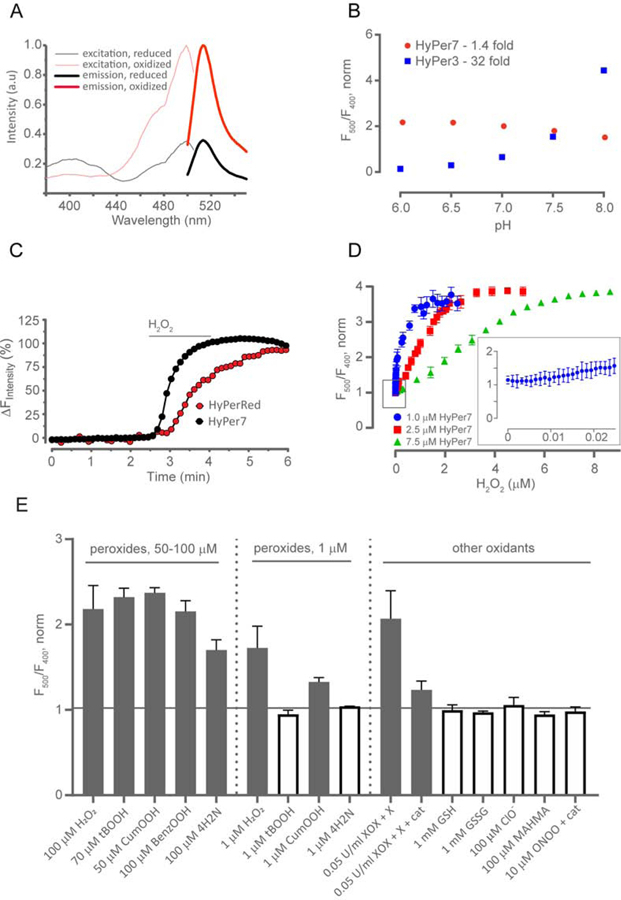
Figure 2.
In vitro characterization of HyPer7. (A) Fluorescence excitation and emission spectra of HyPer7 in oxidized and reduced state. (B) pH-dependency of HyPer7 and HyPer3 in the physiological pH range. F500 and F400 are fluorescence intensities excited at 500 nm and 400 nm, respectively. (C) HyPer7 responds much faster than HyPerRed to the addition of exogenous H2O2 added to Ea926.hy human endothelial cells. Curves represent simultaneous responses to H2O2 treatment (50 μM) of Ea926.hy cells co-expressing HyPer7 (black curve) and HyPerRed (red curve). The speed of HyPer7 response is principally limited by the imaging system used. (D) The response of HyPer7 of the indicated concentrations to increasing concentrations of H2O2. The y-axis represents the HyPer7 ratio, normalized to the ratio prior to the addition of oxidant. Each point represents the mean of three repeats, the error bars denote the standard deviation. The inset depicts the lower nM range for HyPer7 at a concentration of 1 μΜ. (E) Selectivity of HyPer7. Reduced HyPer7 was incubated with the respective substances. XOX = xanthine oxidase; X = xanthine (50 μΜ); cat = catalase (100 nM); tBOOH = tert-butyl hydroperoxide; CumOOH = cumene hydroperoxide; benzOOH = benzoyl hydroperoxide; 4H2N = 4-hydroperoxy 2-nonenal. Catalase was added to ONOO− sample to remove any H2O2. The y-axis represents the HyPer7 ratio, normalized to the ratio obtained with the addition of an equal volume of vehicle (100 mM phosphate buffer, pH 7.4 + 0.1 mM DTPA or acetone for the organic and lipid hydroperoxides). Each bar represents the mean of three replicates and the error bars denote the standard deviation. The dotted vertical lines separate two different concentrations of the organic hydroperoxides and H2O2. The horizontal black line separates the conditions where HyPer7 reacts to the oxidant (gray bars) from those where it does not, i.e. normalized ratio >1 (white bars).

