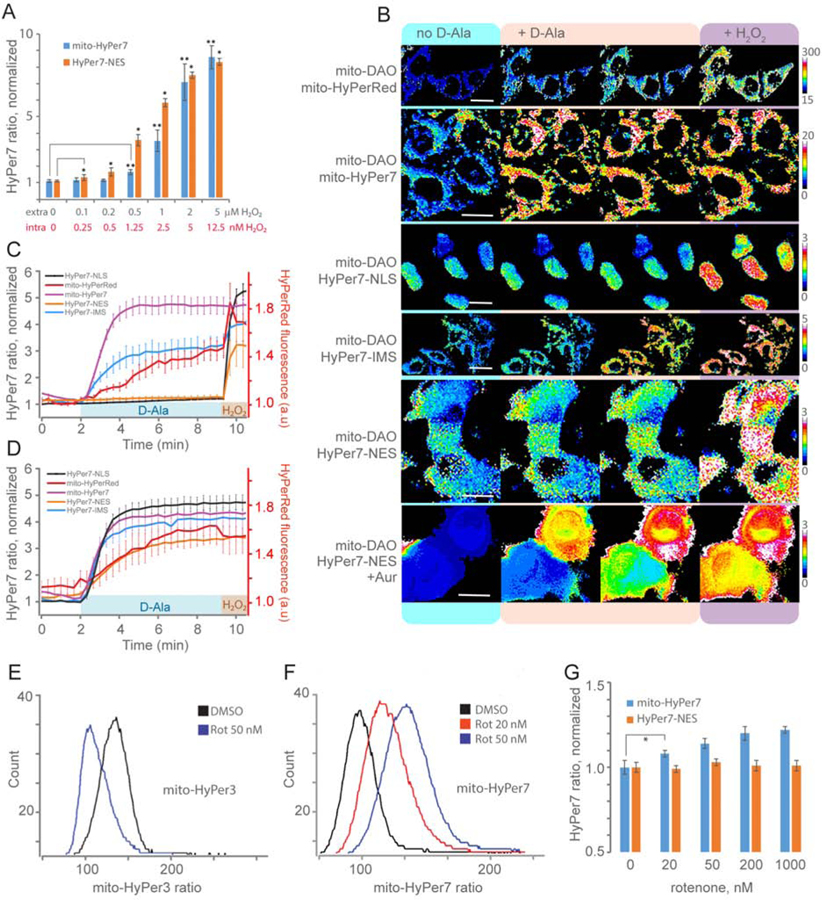
Figure 3.
Mitochondrial H2O2 production: diffusion and topology. (A) HyPer7 F500/F400 ratio in cytosol (NES, nuclear exclusion signal) and mitochondrial matrix (mito) of transiently transfected K562 cells exposed to different concentrations of H2O2. Data are the results of flow cytometry analysis. Each bar represents the mean of N replicates and the error bars denote the standard deviation (at [H2O2] ≤ 0.2 μM N=5, at [H2O2] > 0.2 μM N=3; *,** P < 0.05 versus control using unpaired t-test) (B) Images of HyPer7 and HyPerRed in different compartments of HeLa-Kyoto cells expressing mito-DAO before and after the addition of D-Ala. HyPer7 is targeted to the mitochondrial matrix (mito, scale bar 20 μm), mitochondrial intermembrane space (IMS, scale bar 30 μm), cytosol (NES, nuclear export signal, scale bar 15 μm), nucleus (NLS, nuclear localization signal, scale bar 10 μm). Cells on the lowest panel were preincubated with auranofin (Aur). (C, D) H2O2 dynamics in various compartments of mito-DAO expressing cells in the absence (C) or in the presence (D) of auranofin detected with HyPer7 and HyPerRed. Traces represent mean and standard deviation from at least 10 cells in each of 3 biological replicates. (E, F) Flow cytometry histograms displaying mito-HyPer (E) and mito-HyPer7 (F) ratio signals in K562 cells exposed to rotenone. (G) HyPer7 ratio in cytosol (NES, nuclear exclusion signal) and mitochondrial matrix (mito) of transiently transfected K562 cells exposed to different concentrations of rotenone. Data are the results of flow cytometry analysis. Each bar represents the mean of four replicates and the error bars denote the standard deviation (* P < 0.05 versus control using unpaired t-test).

