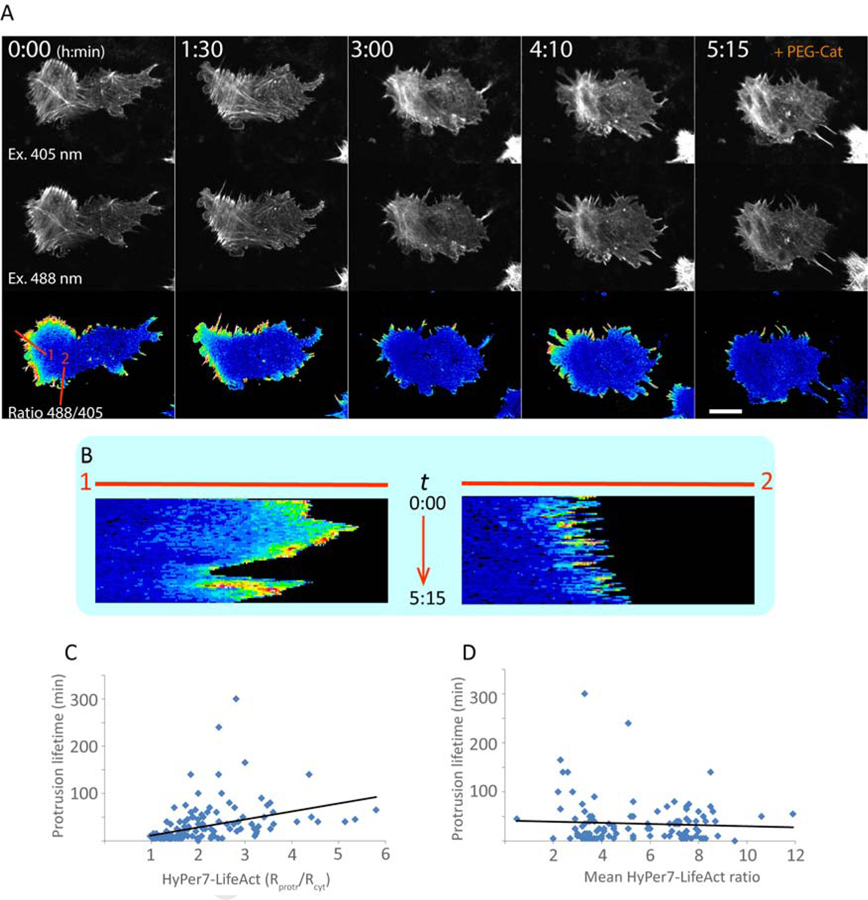
Figure 4.
H2O2 gradients in cell polarization. NIH-3T3 cells transiently expressing HyPer7-LifeAct were imaged during spontaneous migration. (A) Images of a migrating cell at different time points. Upper and middle rows: fluorescent images excited by 405 nm and 488 nm. Lower row: ratiometric images. Addition of PEG-catalase (PEG-Cat) destroys the gradient and leads to retraction of the protrusions. Lines 1 and 2 were used to build kymographs. Scale bar shows 10 μm. (B) Kymographs of the HyPer7-LifeAct ratio along lines 1 and 2 representing the leading edge and the side of the cell from images shown in panel A, respectively. Notice that a more extensive gradient makes the protrusion more stable. (C, D) Correlation plots between the protrusion lifetime and either HyPer-LifeAct ratio gradient (C) or the mean HyPer-LifeAct ratio in the cell demonstrates positive correlation between protrusion stability and the intensity of the H2O2 gradient from the protrusion to the cell body (correlation coefficient 0.37), but not the mean H2O2 levels (correlation coefficient −0.06).

