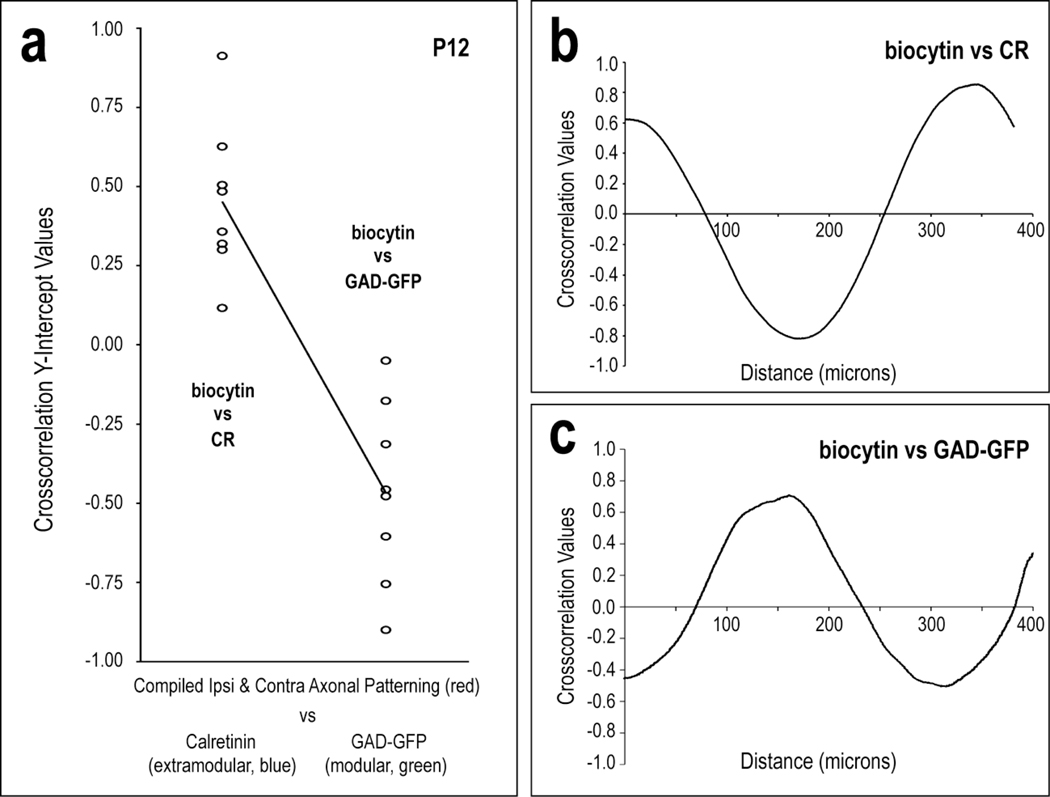
Fig 11.
Quantification of discrete CNIC projection patterns with respect to the LCIC modular-extramodular framework at P12 (a). Significantly different crosscorrelation y-intercept values for biocytin and CR vs. biocytin and GAD confirm projection patterns that overlap extramodular zones and are complementary to LCIC modular fields (p < 0.001). Crosscorrelation of axonal labeling with extramodular waveforms produced positive y-intercepts, whereas that analysis of axonal labeling with modular waveforms produced negative values. The plotted linear regression underscores the disjoint y-intercept values for the extramodular and modular data sets. Representative P12 crosscorrelation functions for contralateral labeling with CR and GAD are depicted in (b) and (c), respectively.

