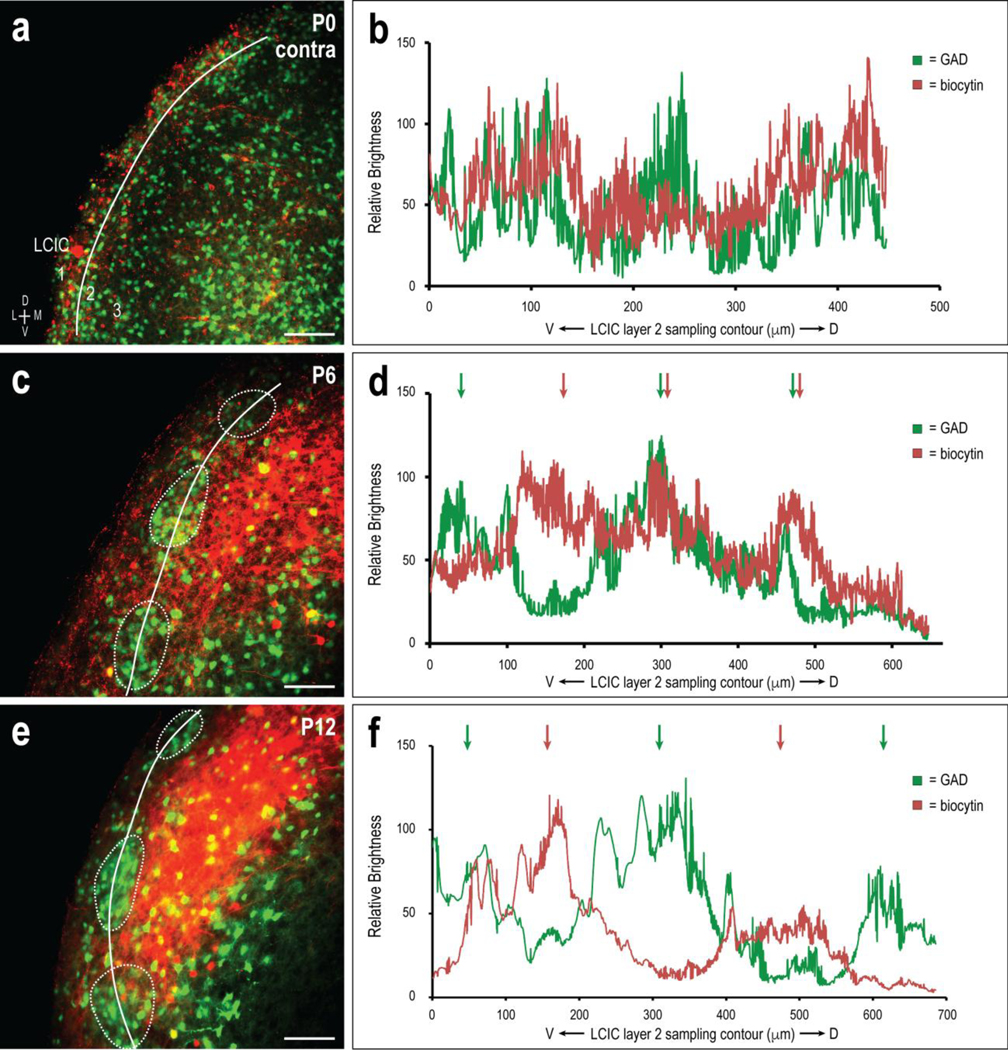
Fig 6.

Developing CNIC projection patterns within the contralateral LCIC with respect to emerging LCIC modular fields. Developmental progression (P0, a; P6, c; P12, e) and corresponding brightness plot profiles (b, d, f) for GAD (green) and biocytin (red) labeling. Signals at birth (b) again gave no consistent indication of periodicity or ordered projection patterns. At P6, periodic waveform components strengthened, with evidence of labeling that appeared spatially offset from GAD modules in some areas, while others showed remnants of projection overlap (d, green and red arrows). While perhaps somewhat delayed in its overall organization at P6 compared to the uncrossed input, crossed projection patterns by P12 were fully sharpened, with clearly extramodular waveforms that were out-of-phase with discontinuous GAD labeling (f, alternating green and red arrows). Scale bars in (a, c, e) = 100μm
