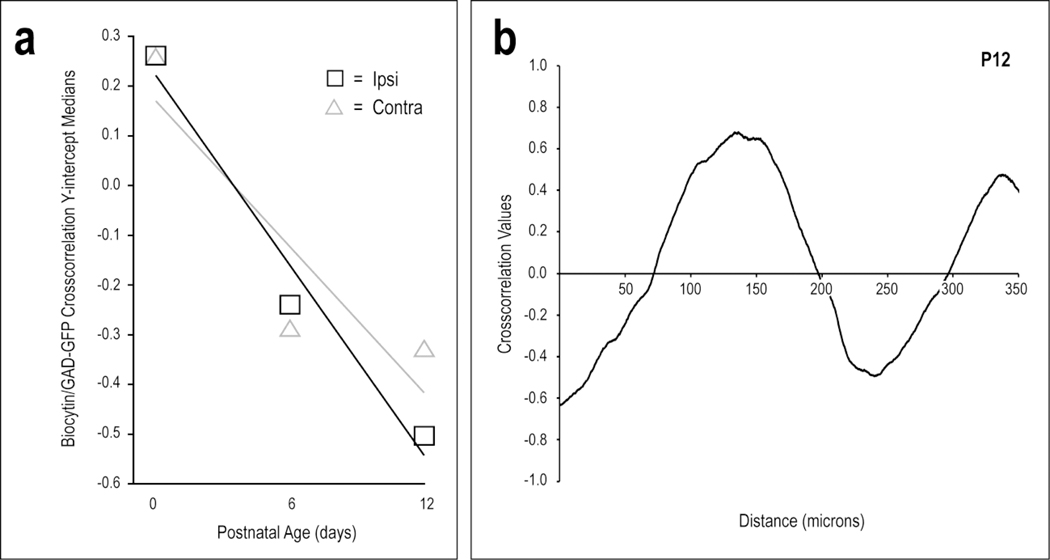
Fig 7.
Quantification of projection pattern shaping over defined critical period. Crosscorrelation y-intercept medians for both the ipsilateral and contralateral inputs consistently decrease with age (a). Linear regressions are shown for each of the plotted projections. These definitive negative trends confirm that both CNIC projections become increasingly complementary to emerging LCIC modular fields. A representative crosscorrelation function of raw data from a P12 ipsilateral case (b) has a y-intercept value of −0.64. Off-origin peaks and troughs indicate spatial shifts between biocytin and GAD signals that align or misalign, respectively.

