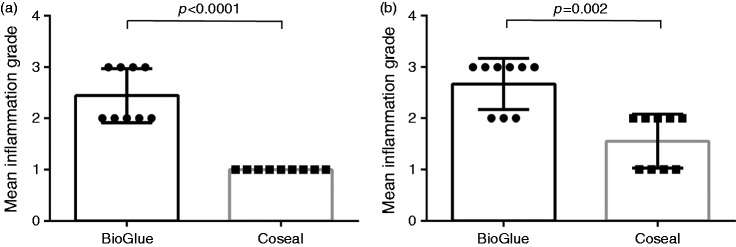
Figure 3.
(a) Mean (±standard deviation (SD)) of grades given by investigators at centre 1; (b) Mean (±SD) of grades given by investigators at centre 2. p-Values were calculated using a Mann–Whitney U test. Inflammation grade: none (0); mild (1); moderate (2); severe (3). The use of means in the figure is for the purpose of illustration.

