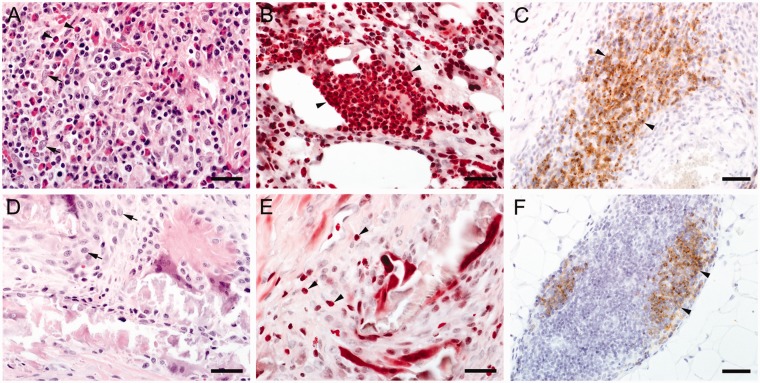
Figure 5.
(a to c) BioGlue, Pattern A: (a) HE staining demonstrating a mixed pattern of epithelioid cells (arrowheads), eosinophilic granulocytes (arrows) and a few plasma cells and lymphocytes, scale bar = 30 μm; (b) Luna staining showing numerous intensively stained (red) eosinophilic granulocytes (arrowheads), scale bar = 30 μm; note that erythrocytes reveal a similar staining pattern, but can be differentiated in high power images as they do not contain nuclei; (c) CD79a immunostaining indicate that many cells of the infiltrate comprise B-lymphocytes (arrowheads), scale bar = 40 μm; (d to f) Coseal, Pattern B: (d) HE staining demonstrating granulomatous inflammation comprising epitheloid cells (arrows), scale bar = 30 μm; (e) Just single eosinophilic granulocytes can be found by Luna staining (arrowheads), scale bar = 30 μm; (f) Some immunopositive B-cells can be demonstrated by CD79a immunohistochemistry (arrowheads), scale bar = 40 μm.

