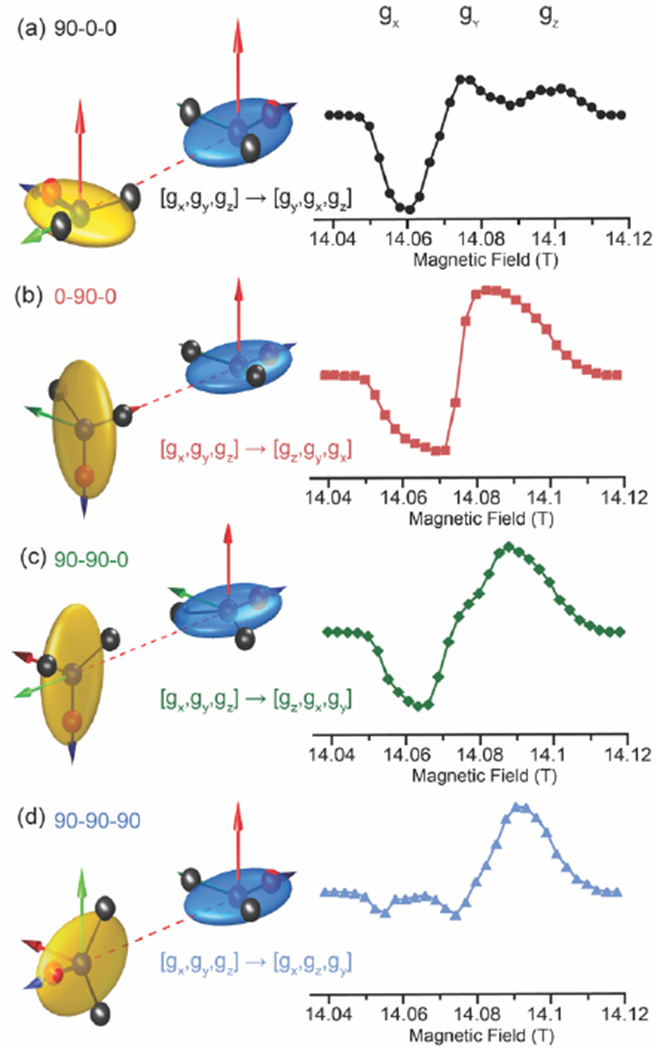
Fig. 1:

3D representation of four relative g-tensor orientations and their respective simulated MAS-DNP field profiles (a) Ω = [90,0,0], black circles; (b) Ω = [0,90,0], red squares, (c) Ω = [90,90,0], green diamonds, (d) Ω = [90,90,90], blue triangles. For illustration, the dipolar Euler angle is set to [0,−90,0]. Blue arrow = x axis, green arrow = y axis, and red arrow = z axis. On top of the MAS-DNP profile are indicated the “gx, gy, gz” regions. The ZYZ convention is being used here assuming active rotation and the angles are in degrees.
