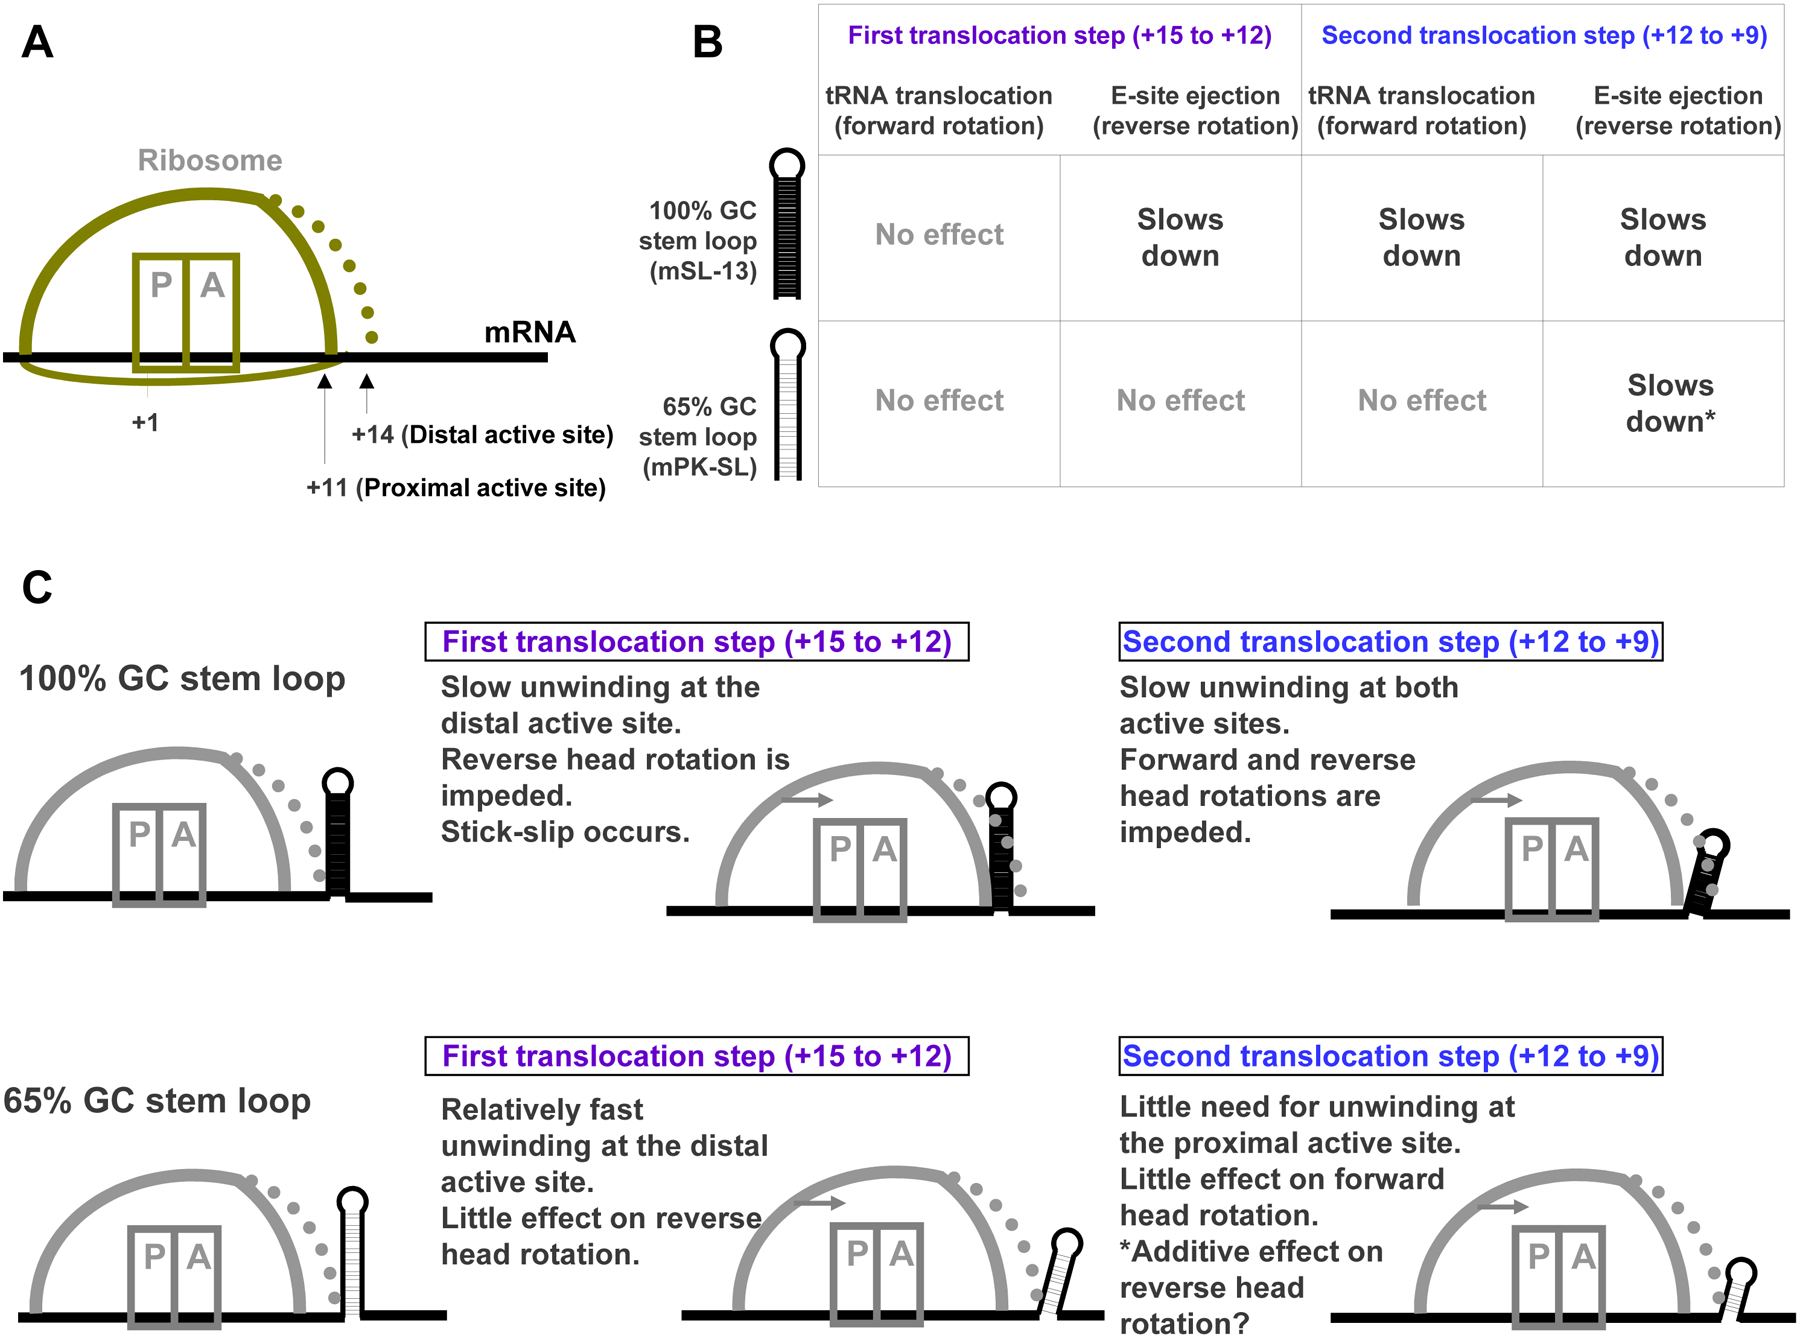
Fig. 9. Explaining the effect of mRNA secondary structures on translation rates using the model.

A. Cartoon representing the ribosome and its proximal and distal helicase active sites. B. Summary of experimental data [22] on the effect of two stem-loop structures, with 100% and 65% GC content, on translocation rates (adapted from Table S2 in the reference). C. Predictions of the tandem active site model for the rates of the steps outlined in panel B.
