
Fig. 1.
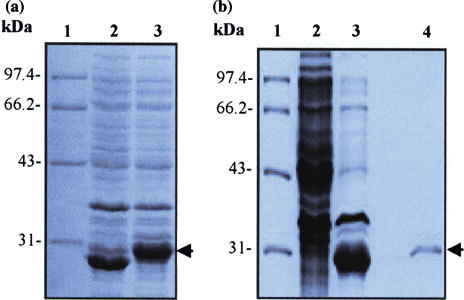
SDS-PAGE analysis on expression and purity of M protein in E. coli BL21. (a) SDS-PAGE analysis of expression of M protein in E. coli BL21. E. coli BL21 was transformed with the recombinant plasmid pSARS-M, followed by induction with IPTG. The bacterial cultural crude materials were subjected to the 10% SDS-PAGE. Lane 1: molecular weight marker; Lane 2: cellular extracts of TPTG-induced BL21 transformed with the empty plasmid pGEX-6P-1 (control); Lane 3: cellular extracts of IPTG-induced BL2 1 transformed with the recombinant pSARS-M construct. (b) SDS-PAGE analysis of purity of recombinant M protein after purified by affinity chromatography. The crude material of BL21 transformed with pSARS-M plasmid was subjected to sonication. The supernatants were filtered through a 0.45 μm nitrocellulose membrane and loaded onto Glutathione Sepharose 4B affinity chromotography column. The purified proteins were detected by SDS-PAGE. Lane 1: molecular weight marker; Lane 2: total cellular extracts of IPTG-induced BL21 (control); Lane 3: total cellular extracts of IPTG-induced BL21 transformed with the recombinant pSARS-M construct (control); Lane 4: eluted protein of IPTG-induced BL21 transformed with the recombinant pSARS-M construct from affinity chromatography purification. Arrows indicate M fusion protein expressed in E coli BL21 (left) and purified M fusion protein (right). The gel was stained by Coomassie blue. The molecular mass size markers (in KDa) are reported on the left of each Figure