
Fig. 7.
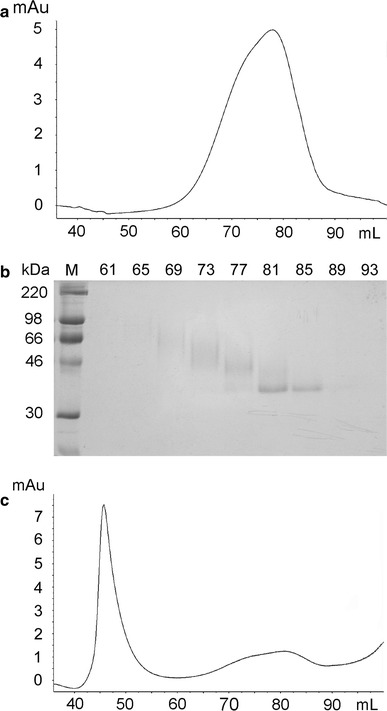
Glycosylated S1c is monomeric while deglycosylated S1c forms aggregates. a Elution profile of glycosylated S1c showed that a board peak between 50 and 90 ml was detected while the peak height reached a maximum at 78 ml. b Fractions of glycosylated S1c separated by SEC were analyzed by SDS-PAGE. The major band of 35 kDa was eluted in 80–85 ml. Lane M: prestained protein markers; subsequent numbers: the numbers of fractions collected during the analysis of S1c by SEC. c When the deglycosylated S1c was analysed by SEC, the protein was eluted at void volume, suggesting that the deglycosylated protein formed soluble aggregates