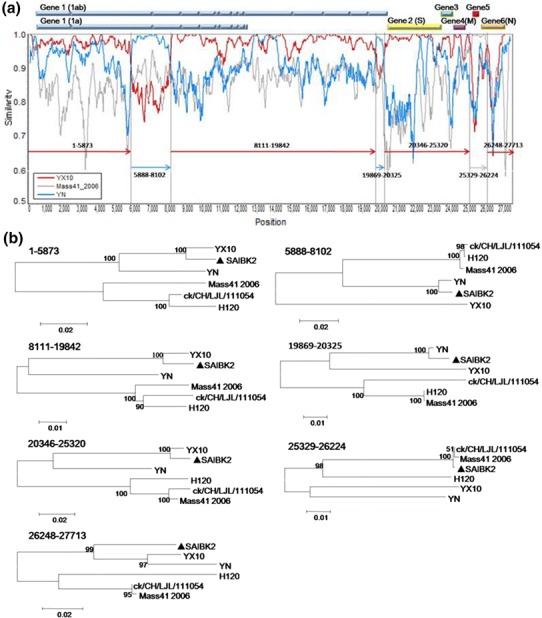
Fig. 3.

Recombination analysis of isolate SAIBK2. SimPlot analysis was performed using SAIBK2 as the query sequence (a). Bars at the top represent relative positions of Genes of IBV. The dummy lines show the deduced breakpoints. The arrows show different regions and their colors are the same as those of the parent viruses. The numbers above those arrows show corresponding nucleotide positions in the alignment. The y axis shows the percentage similarity within a sliding window of 200 bp centered on the position plotted, with a step size between plots of 20 bp. Phylogenetic trees of genome positions 1-5873, 5888-8102, 8111-19842, 19869-20325, 20346-25320, 25329-26224, and 26248-27713 among SAIBK2, YX10, YN, and three Mass-type viruses (H120, ck/CH/LJL/111054, and Mass41_2006) (b). Phylogenetic trees were constructed by neighbor-joining method (bootstrapping for 1000 replicates). Sequence of SAIBK2 was labeled by filled triangle
