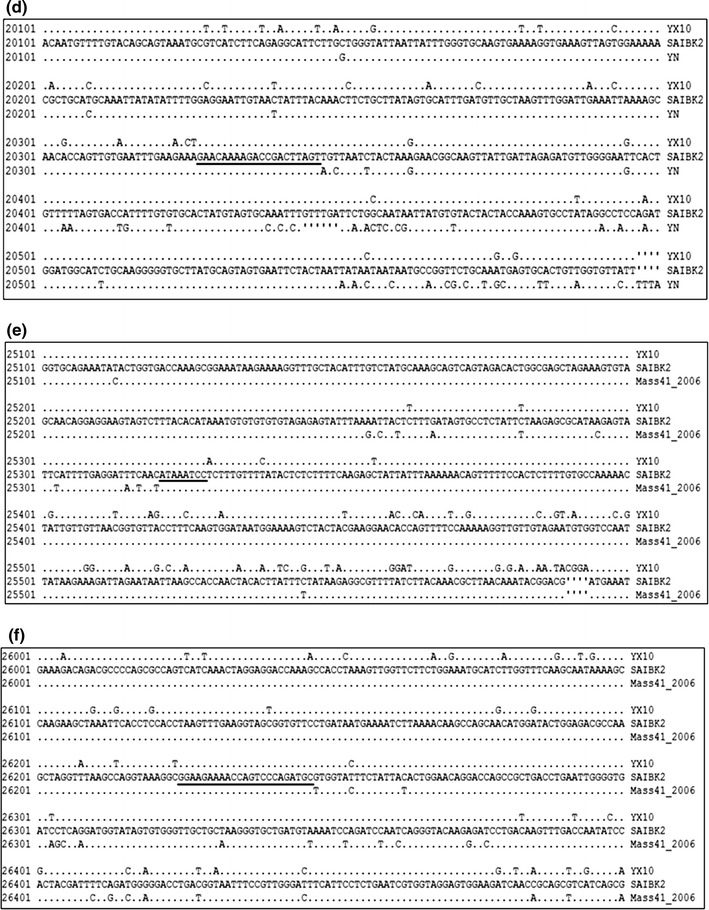
Fig. 4.


Analysis of breakpoint. a–d are breakpoint analysis between SAIBK2, YX10, and YN. e, f are breakpoint analysis between SAIBK2, YX10, and Mass41 2006. Numbers in the left show the nucleotide position in the alignment. Only the nucleotides which differ from those of SAIBK2 are listed. The breakpoints are underlined. The deleted nucleotides are indicated by prime
