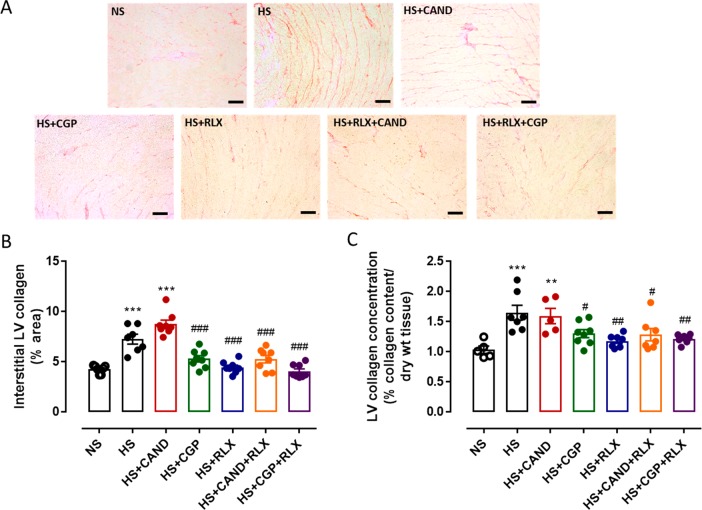
Figure 2.
(A) Representative images for interstitial fibrosis stained with picrosirius red (indicated by red) in left ventricle (LV) sections obtained from FVB/N mice fed on a normal salt (NS, 0.5% NaCl) diet or mice fed on a high salt (HS, 5% NaCl) diet in the presence or absence of RLX (0.5 mg/kg/day), CGP (1.44 mg/kg/day), CAND (2 mg/kg/day), or RLX with CAND or CGP. Scale bar for all images = 50 μm. (B) Group data of % area of interstitial fibrosis in LV sections, or (C) total tissue collagen measured by hydroxyproline assay in LV tissue from same animal groups in which picrosirius red staining was performed (n = 7–8 per group). All data are expressed as mean ± s.e.m. (∗∗) P < 0.01, (∗∗∗) P < 0.001 vs NS; (#) P < 0.05, (##) P < 0.01, (###) P < 0.001 vs HS, determined by One-Way ANOVA with Tukey correction for multiple comparisons.

