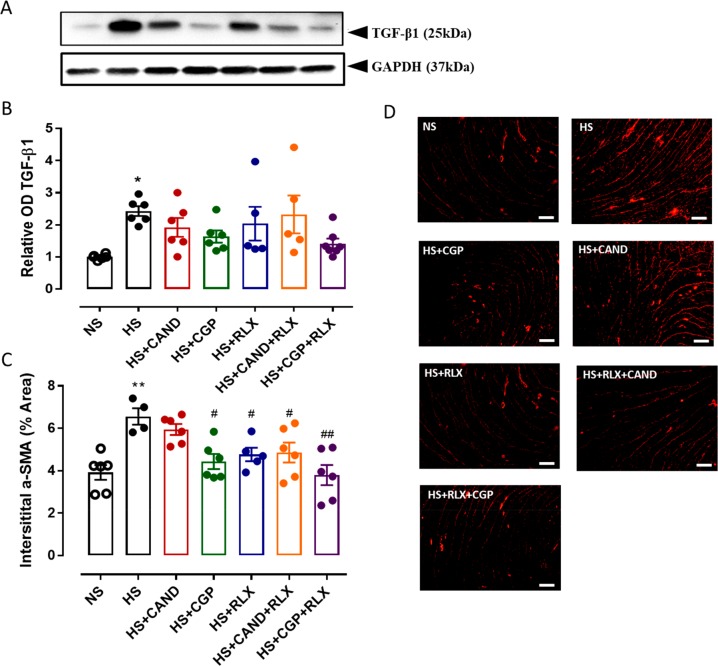
Figure 3.
(A) Representative Western blots of TGF-β1 (25 kDa) and GAPDH (37 kDa) from LV obtained from FVB/N mice fed on a normal salt (NS, 0.5% NaCl) diet or mice fed on a high salt (HS, 5% NaCl) diet in the presence or absence of RLX (0.5 mg/kg/day), CGP (1.44 mg/kg/day), CAND (2 mg/kg/day), or RLX with CAND or CGP (n = 5–7 per group). (B) Densitometric quantification of Western blots of TGF-β1 protein expression from indicated groups. Loading was adjusted by normalizing to GAPDH protein expression for each animal. All treatments were presented as a ratio to NS. (C) α-SMA expression quantified as % area from indicated groups. (n = 4–6 per group). All data are expressed as mean ± s.e.m. (∗) P < 0.05, (∗∗) P < 0.01 vs NS; (#) P < 0.05, (##) P < 0.01 vs HS, determined by One-Way ANOVA with Tukey correction for multiple comparisons. (D) Representative immunofluorescence staining images of α-SMA from same treatment groups as panel C. Scale bar for all images = 50 μm.

