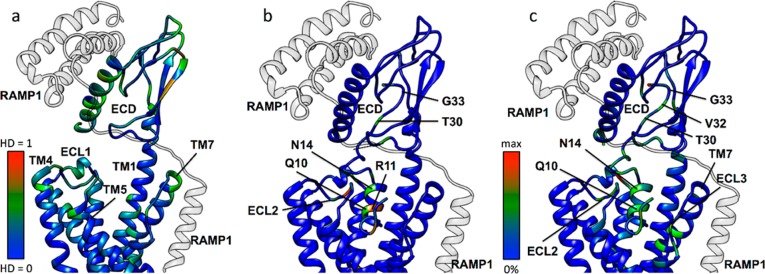
Figure 5.
(a) Hellinger distance (HD) analysis of the ϕ,ψ protein backbone angles for CTR in the presence and absence of RAMP1 (transparent gray ribbon). For each residue, the higher HD value between ϕ and ψ is displayed on a model of the CTR structure (peptide omitted for clarity), with small values shown in blue and large values (indicating significant conformational differences) in red. (b) The difference in CTR and amylin (both ribbons) intermolecular hydrogen bond contacts in the presence and absence of RAMP1, with small values shown in blue and large values in red. (c) The difference in CTR and amylin (both ribbons) intermolecular contacts in the presence and absence of RAMP1, with small values shown in blue and large values in red.

