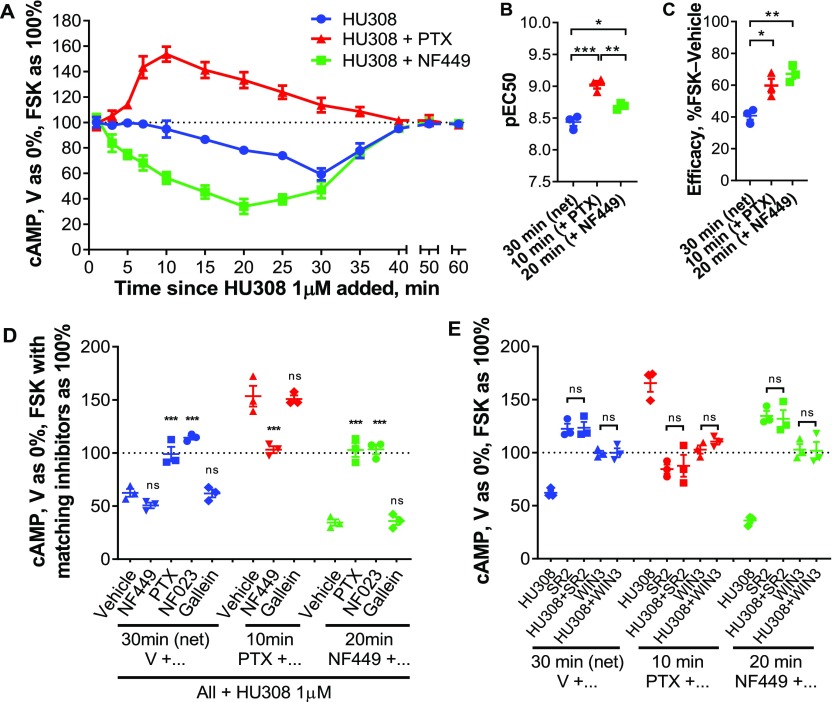
Figure 2.
cAMP signaling in human primary PBMC. (A) PBMC were incubated with 10 μM forskolin (FSK) and HU308 (1 μM) without inhibitors (blue ●), or after pretreatment with NF449 (10 μM for 30 min, green ■), or with PTX (100 ng/mL for 6 h, red ▲). The graph shows mean ± SEM of three independent experiments performed in technical triplicate, each with cells from a separate subject (three subjects in total). (B,C) HU308 concentration–response curve parameters; potency (B) and efficacy (C; span of curves as in Figure S3). Statistical comparisons by one-way ANOVA with Tukey posthoc test. (D,E) Stimulations were with 10 μM forskolin and 1 μM HU308 or vehicle for 30 min for net cAMP flux, 10 min for the stimulatory pathway (revealed by PTX), or 20 min for the inhibitory pathway (revealed by NF449). (D) PBMC were additionally pretreated as indicated with PTX, NF449, NF023, or gallein. Data are normalized to vehicle control as 0% and forskolin controls with matching inhibitors as 100%. Statistical comparisons are to the vehicle plus HU308 control within each set, measured by one-way ANOVA with Tukey posthoc test. (E) PBMC were pretreated as indicated, then coincubated with forskolin (10 μM), SR144528 (SR2, 1 μM), or WIN55212-3 (WIN-3, 5 μM), and HU308 (100 nM) or vehicle for 10, 20, or 30 min. Data are normalized to vehicle control as 0% and forskolin control as 100%. All SR2 and WIN-3 conditions were significantly different from “HU308” control for peak signaling within each set (p < 0.0001–0.004). Within each set, condition “SR2” was compared to “SR2 + HU308”, “WIN3” was compared to “WIN3 + HU308”, and had no significant difference. Statistical comparisons by one-way ANOVA with Tukey posthoc test. Graphs B–E show independent experiment means (from technical triplicate) as well as overall mean ± SEM of these three independent experiments each performed with cells from a separate subject (three subjects in total).

