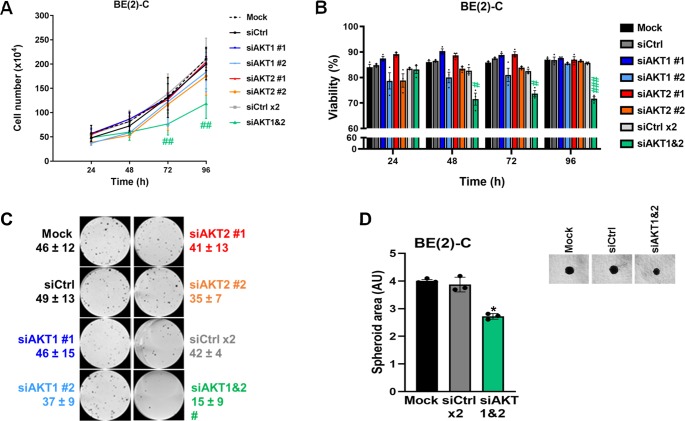
Figure 2.
Functional inhibition of total AKT activity is associated with a decrease in neuroblastoma cell proliferation. (A) Cell number and (B) cell viability analysis were performed using Trypan Blue dye exclusion assay on BE(2)-C cells after transfection with mock, control siRNA (siCtrl), and AKT isoform siRNA (siAKT1 nos. 1 and 2, siAKT2 nos. 1 and 2) at the indicated time points. Data are reported as averages (n = 3, ± S.E.M). Statistics were calculated by comparing control siRNA-treated cells with AKT isoform siRNA (#, p < 0.05; ##, p < 0.01; ###, p < 0.001). (C) Representative pictures of clonogenic assay for mock, control siRNA, and AKT isoform-specific siRNA (siAKT1 nos. 1 and 2, siAKT2 nos. 1 and 2). Means of at least three individual assays. Statistics were calculated by comparing the colony number of the control siRNA-treated cells with the AKT isoform-transfected cells. (#, p < 0.05). (D) Representative pictures of 3D BE(2)-C spheroids after transfection with mock, siCtrl, siAKT1, and AKT2. Spheroid area (arbitrary unit, AU) was determined at 8 days after cell seeding. Data are reported as averages (n = 3, ± S.E.M). Statistics were calculated by comparing control siRNA-treated cells with AKT isoform siRNA (*, p < 0.05).

