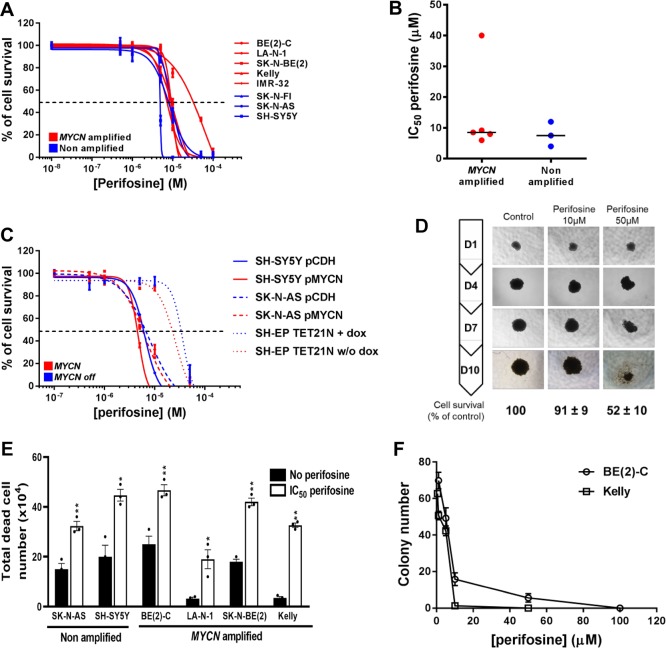
Figure 3.
Pan-AKT inhibitor perifosine decreases cell proliferation in 2D and 3D culture neuroblastoma models. (A) Growth inhibition assay performed on a panel of neuroblastoma cell lines using Alamar Blue after 72 h incubation with a range of concentrations of perifosine. Means of at least three individual experiments: bars, SEM; log scale for x axis. (B) Plots for the IC50 values of perifosine on a panel of neuroblastoma cell lines harboring (n = 5) or lacking (n = 3) MYCN amplification. (C) Growth inhibition assay performed in three neuroblastoma cells with MYCN expression modulation using Alamar Blue after 72 h incubation with a range of concentrations of perifosine. Means of at least three individual experiments: bars, SEM; log scale for x axis. (D) Representative pictures of 3D BE(2)-C spheroids treated with a range of perifosine concentrations. Results were expressed as a percentage of growth in non-treated spheroids at day 10. Mean ± SEM of three independent experiments are shown. (E) Total dead cell number on a panel of neuroblastoma cell lines treated with 72h of the IC50 perifosine concentration. Data are reported as averages (n = 3, ± SEM). Statistics were calculated by comparing the untreated cells with perifosine-treated cells (*, p < 0.05; **, p < 0.01). (F) Clonogenic assays were done on two MYCN-amplified neuroblastoma cell lines treated with a range of perifosine concentration. Means of three individual assays; bars, SEM. Statistics were calculated by comparing the colony number of the untreated cells with perifosine-treated cells at each concentration (***, p < 0.001).

