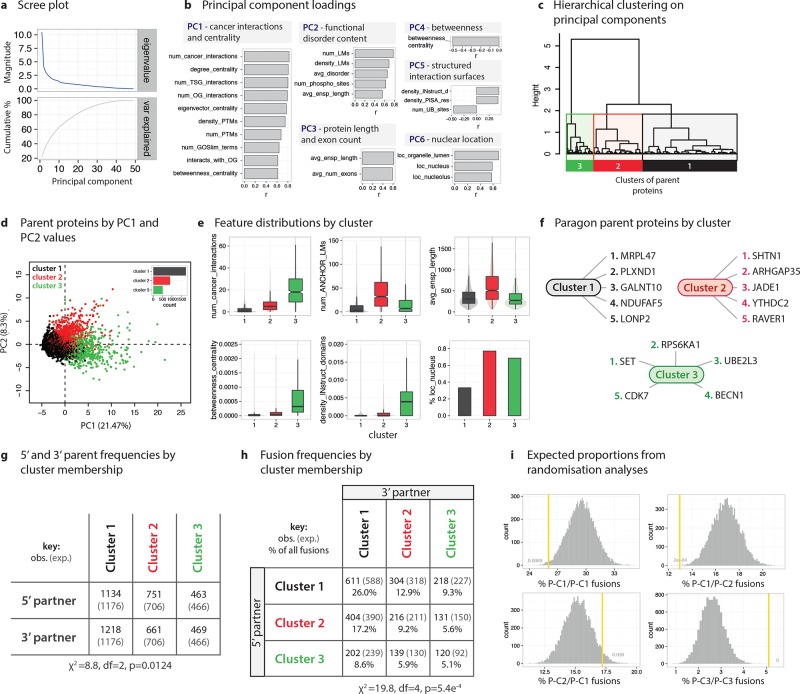
Figure 2.
Molecular Signatures of Fusion: Identification and characterization of parent protein subgroups. (a) Scree plot showing the eigenvalues and cumulative variance explained by successive principle components (PCs). (b) Loadings on the PCs showing the correlations (r) between features and the first 6 PCs. Headers to PC boxes conceptually summarize the correlations. Variable names, descriptions, and data sources are available as Table S1. Shortened variable names used for display purposes: num_LMs, num_ANCHOR_LMs; density_LMs, density_ANCHOR_LMs; density_INstruct_d, density_INstruct_domains. (c) Hierarchical clustering was performed on the values of the first 10 PCs, yielding three clusters of parent proteins. (d) Parent proteins plotted by PC1 and PC2 values, colored by cluster. (e) Distributions of key features by cluster. The features chosen highly correlate with the first six PCs. (f) Paragon parent proteins are instances closest to cluster centroids, and therefore represent “average” cases for the cluster. Five paragon examples (i.e., the five points closest to the centroid) are provided for each cluster. (g) Frequencies of parent proteins acting as either the 5′ or 3′ parent by cluster. (h) Fusion frequencies by cluster membership and 5′ versus 3′ parent status. (i) Expected proportions of intercluster fusions derived from randomization analyses. Random fusions were generated by sampling twice from the three parent cluster gene sets.

