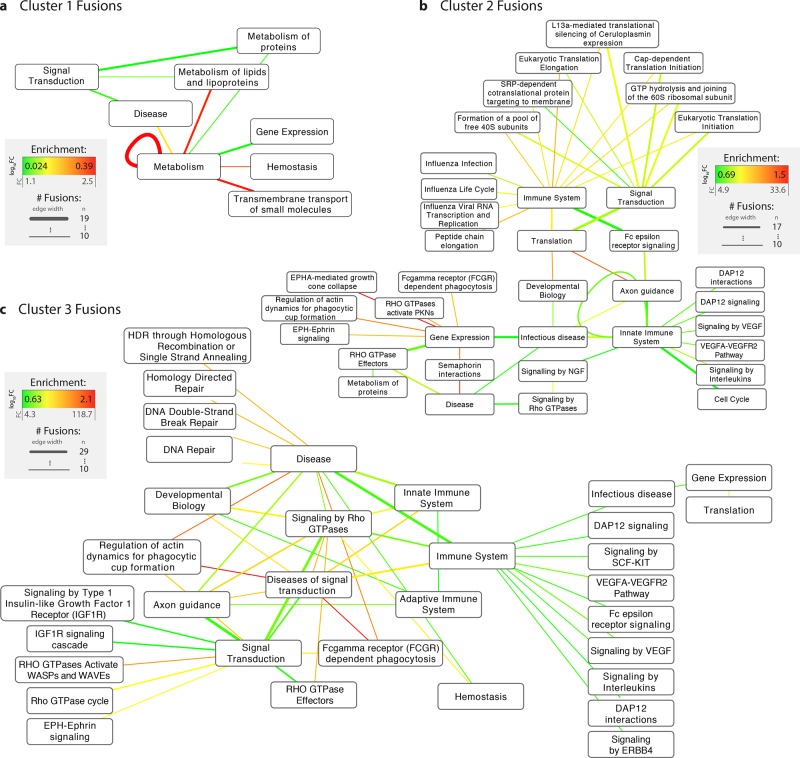
Figure 4.
Fusion hallmarks: trends in cellular pathways fusions by fusion event cluster. REACTOME gene pathway annotation was mapped onto parent proteins in fusion events and enrichment was assessed using randomization analyses. Nodes indicate pathways, and edges indicate the occurrence of a fusion between them (i.e., between two genes which participate in the pathways). Edge widths denote the number of unique fusion events associated with a specific pathway fusion, and edge colors represent enrichments, whereby enrichments are calculated as the log10 fold change between observed fusion frequencies and expected frequencies derived by randomly pairing any two human protein-coding genes 1 000 000 times (see Online Methods). Using only parent proteins as the sampling set for generating background frequencies results in highly similar results (see Figure S2). Only pathways that were fused in 10 or more different fusion events are shown.

