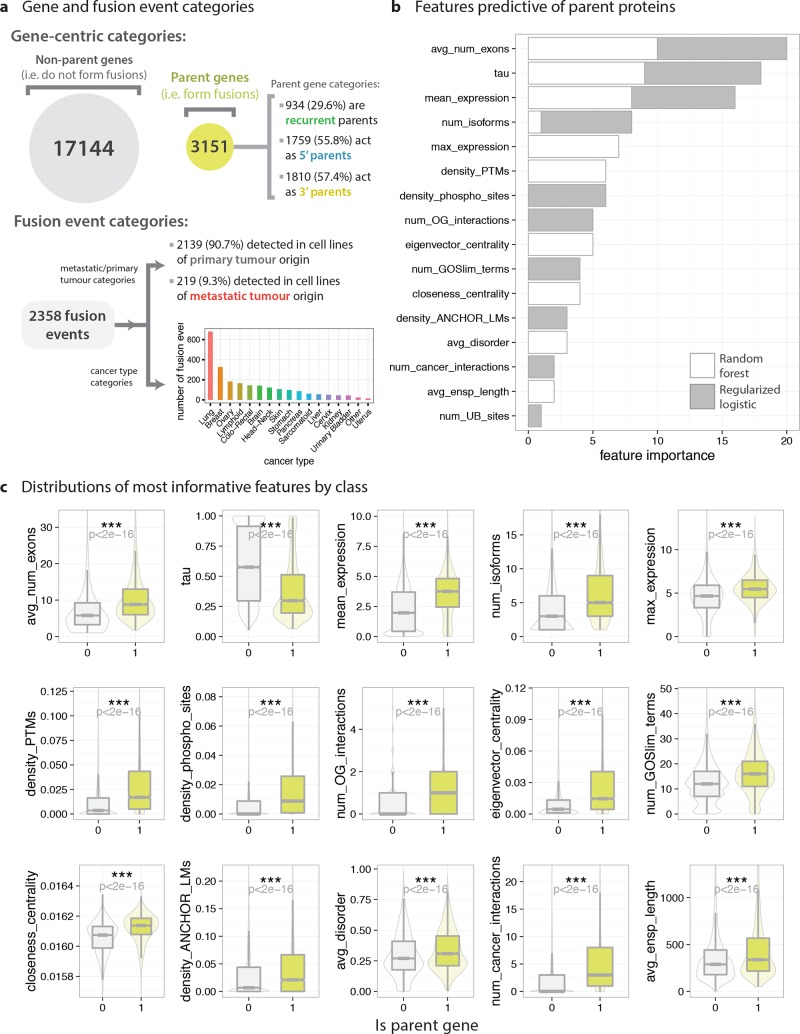
Figure 6.
Predictive characteristics of fusion parent proteins. RF and RLR models were trained to distinguish between parent proteins and all other proteins on the basis of their gene- and protein-level properties (or features) on a balanced data set. (a) Categories of parent genes and fusion events within the data set, used as target labels for subsequent classification tasks. (b) Most informative features for distinguishing parent proteins from nonparent proteins, as ranked by the random forest and regularized logistic regression models. Higher values in stacked bar plots indicate higher predictive importance (see Figure 1d and Online Methods for details). Feature rankings are returned in highly different formats by the RF and RLR models, but were made comparable by considering ordinal rankings only. (c) Distributions of most predictive variables for parent proteins (lime green) and nonparent proteins (light gray). Boxplots (with outliers removed) are overlaid on violin plots. Differences in distributions were quantified using nonparametric Wilcoxon rank sum tests (for numerical variables), chi-squared tests (categorical data), and Fisher’s exact tests (categorical data where any cell count is less than 30).

